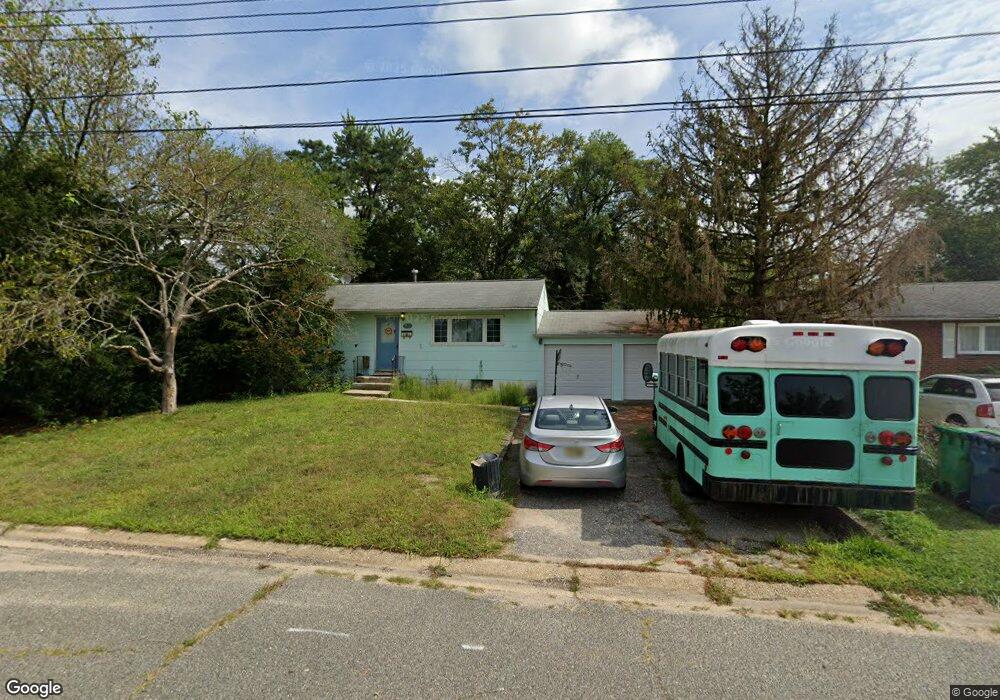
20 Carnegie St Toms River, NJ 08757
Estimated Value: $301,691 - $405,000
2
Beds
1
Bath
1,728
Sq Ft
$213/Sq Ft
Est. Value
About This Home
This home is located at 20 Carnegie St, Toms River, NJ 08757 and is currently estimated at $368,173, approximately $213 per square foot. 20 Carnegie St is a home located in Ocean County with nearby schools including St Joseph Grade School, Ambassador Christian Academy, and Donovan Catholic High School.
Ownership History
Date
Name
Owned For
Owner Type
Purchase Details
Closed on
Oct 7, 2011
Sold by
Krause Donald W and Krause Cheryl A
Bought by
Krause Cheryl A
Current Estimated Value
Purchase Details
Closed on
Dec 18, 2000
Sold by
Gerundo Robert
Bought by
Sipe Jesse
Home Financials for this Owner
Home Financials are based on the most recent Mortgage that was taken out on this home.
Original Mortgage
$94,400
Outstanding Balance
$34,812
Interest Rate
7.71%
Estimated Equity
$333,361
Create a Home Valuation Report for This Property
The Home Valuation Report is an in-depth analysis detailing your home's value as well as a comparison with similar homes in the area
Home Values in the Area
Average Home Value in this Area
Purchase History
| Date | Buyer | Sale Price | Title Company |
|---|---|---|---|
| Krause Cheryl A | -- | None Available | |
| Sipe Jesse | $118,000 | -- | |
| Sipe Jesse | $118,000 | -- |
Source: Public Records
Mortgage History
| Date | Status | Borrower | Loan Amount |
|---|---|---|---|
| Open | Sipe Jesse | $94,400 | |
| Closed | Sipe Jesse | $94,400 |
Source: Public Records
Tax History Compared to Growth
Tax History
| Year | Tax Paid | Tax Assessment Tax Assessment Total Assessment is a certain percentage of the fair market value that is determined by local assessors to be the total taxable value of land and additions on the property. | Land | Improvement |
|---|---|---|---|---|
| 2025 | $4,748 | $144,500 | $66,000 | $78,500 |
| 2024 | $4,581 | $144,500 | $66,000 | $78,500 |
| 2023 | $4,464 | $144,500 | $66,000 | $78,500 |
| 2022 | $4,464 | $144,500 | $66,000 | $78,500 |
| 2021 | $4,426 | $144,500 | $66,000 | $78,500 |
| 2020 | $4,313 | $144,500 | $66,000 | $78,500 |
| 2019 | $4,271 | $144,500 | $66,000 | $78,500 |
| 2018 | $4,195 | $144,500 | $66,000 | $78,500 |
| 2017 | $4,137 | $144,500 | $66,000 | $78,500 |
| 2016 | $4,037 | $144,500 | $66,000 | $78,500 |
| 2015 | $4,484 | $205,400 | $100,000 | $105,400 |
| 2014 | $4,315 | $205,400 | $100,000 | $105,400 |
Source: Public Records
Map
Nearby Homes