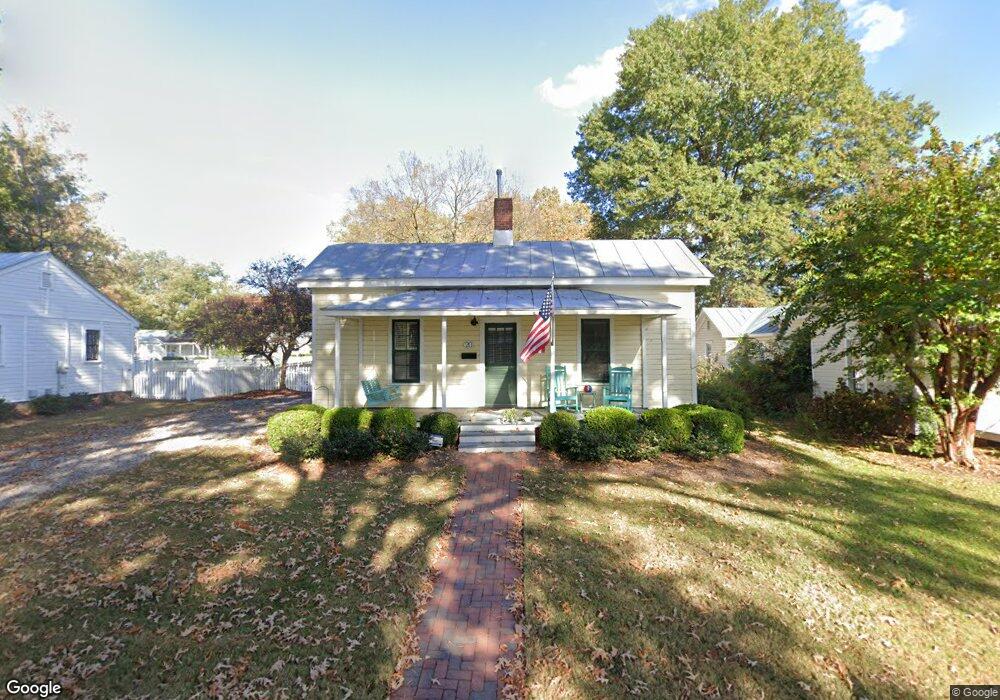
20 Carr St Rocky Mount, NC 27804
Estimated Value: $110,000 - $252,000
2
Beds
1
Bath
1,142
Sq Ft
$136/Sq Ft
Est. Value
About This Home
This home is located at 20 Carr St, Rocky Mount, NC 27804 and is currently estimated at $155,538, approximately $136 per square foot. 20 Carr St is a home located in Nash County with nearby schools including Williford Elementary School, Englewood Elementary School, and Rocky Mount Middle School.
Ownership History
Date
Name
Owned For
Owner Type
Purchase Details
Closed on
May 4, 2016
Sold by
Craig Cindy and Craig Douglas A
Bought by
Rocky Mount Village Llc
Current Estimated Value
Purchase Details
Closed on
Jun 9, 2009
Sold by
Haines Jennifer E and Harmon Jennifer Elizabeth
Bought by
Pridgen Cindy Renea
Home Financials for this Owner
Home Financials are based on the most recent Mortgage that was taken out on this home.
Original Mortgage
$91,461
Interest Rate
4.77%
Mortgage Type
Purchase Money Mortgage
Purchase Details
Closed on
Jun 20, 2007
Sold by
Harmon Jennifer Elizabeth and Wells Jennifer E
Bought by
Harmon Jennifer Elizabeth
Purchase Details
Closed on
Aug 25, 2006
Sold by
Mozingo Tiffany L
Bought by
Wells Jennifer E
Home Financials for this Owner
Home Financials are based on the most recent Mortgage that was taken out on this home.
Original Mortgage
$96,350
Interest Rate
6.25%
Mortgage Type
Purchase Money Mortgage
Create a Home Valuation Report for This Property
The Home Valuation Report is an in-depth analysis detailing your home's value as well as a comparison with similar homes in the area
Home Values in the Area
Average Home Value in this Area
Purchase History
| Date | Buyer | Sale Price | Title Company |
|---|---|---|---|
| Rocky Mount Village Llc | $80,000 | Attorney | |
| Pridgen Cindy Renea | $94,500 | None Available | |
| Harmon Jennifer Elizabeth | -- | None Available | |
| Wells Jennifer E | $96,500 | None Available |
Source: Public Records
Mortgage History
| Date | Status | Borrower | Loan Amount |
|---|---|---|---|
| Previous Owner | Pridgen Cindy Renea | $91,461 | |
| Previous Owner | Wells Jennifer E | $96,350 |
Source: Public Records
Tax History
| Year | Tax Paid | Tax Assessment Tax Assessment Total Assessment is a certain percentage of the fair market value that is determined by local assessors to be the total taxable value of land and additions on the property. | Land | Improvement |
|---|---|---|---|---|
| 2025 | $523 | $83,050 | $10,000 | $73,050 |
| 2024 | $523 | $89,060 | $10,000 | $79,060 |
| 2023 | $597 | $89,060 | $0 | $0 |
| 2022 | $610 | $89,060 | $10,000 | $79,060 |
| 2021 | $597 | $89,060 | $10,000 | $79,060 |
| 2020 | $597 | $89,060 | $10,000 | $79,060 |
| 2019 | $597 | $89,060 | $10,000 | $79,060 |
| 2018 | $597 | $89,060 | $0 | $0 |
| 2017 | $597 | $89,060 | $0 | $0 |
| 2015 | $518 | $77,265 | $0 | $0 |
| 2014 | $518 | $77,265 | $0 | $0 |
Source: Public Records
Map
Nearby Homes
- 1154 Saddlebrook Dr
- 1114 & 1116 Gold St
- 724 Mill St
- 1119 Falling River Walk
- 711 Mill St
- 757 Columbia Ave
- 1005 W Thomas St
- 1522 W Thomas St
- 1148 Sunset Ave
- 1534 W Thomas St
- 521 Falls Rd
- 1420 Raymond St
- 521 Jefferson St
- 1005 Sunset Ave
- 1400 Dogwood Ave
- 827 Sunset Ave
- 625 E Ridge St
- 805 Sunset Ave
- 1417 Sunset Ave
- 224 Willow St Unit A, B
Your Personal Tour Guide
Ask me questions while you tour the home.