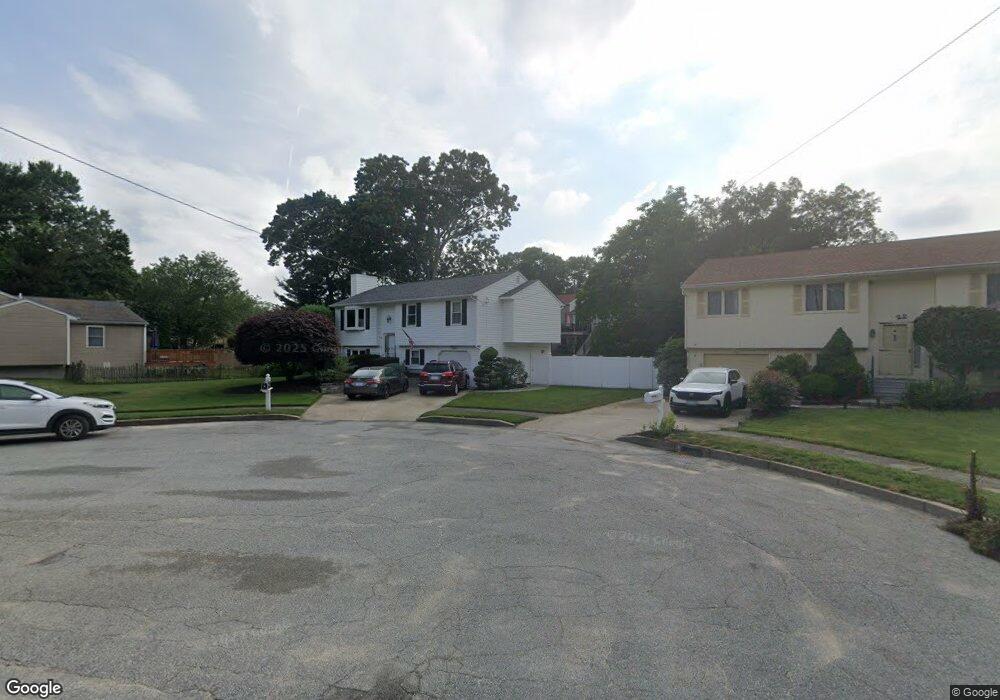
20 Chaple Dr Cranston, RI 02920
Western Cranston NeighborhoodEstimated Value: $478,311 - $606,000
3
Beds
2
Baths
2,000
Sq Ft
$265/Sq Ft
Est. Value
About This Home
This home is located at 20 Chaple Dr, Cranston, RI 02920 and is currently estimated at $530,328, approximately $265 per square foot. 20 Chaple Dr is a home located in Providence County with nearby schools including Glen Hills School, Western Hills Middle School, and Cranston High School West.
Ownership History
Date
Name
Owned For
Owner Type
Purchase Details
Closed on
Dec 1, 1998
Sold by
Girgenti Joseph V and Girgenti Jacqueline
Bought by
Vallesi Michael A and Vallesi Jeannine
Current Estimated Value
Purchase Details
Closed on
Oct 12, 1990
Sold by
R A Savarese Cust Bldr
Bought by
Girgenti Joseph V
Create a Home Valuation Report for This Property
The Home Valuation Report is an in-depth analysis detailing your home's value as well as a comparison with similar homes in the area
Home Values in the Area
Average Home Value in this Area
Purchase History
| Date | Buyer | Sale Price | Title Company |
|---|---|---|---|
| Vallesi Michael A | $140,000 | -- | |
| Girgenti Joseph V | $151,500 | -- |
Source: Public Records
Mortgage History
| Date | Status | Borrower | Loan Amount |
|---|---|---|---|
| Open | Girgenti Joseph V | $188,000 | |
| Closed | Girgenti Joseph V | $22,000 |
Source: Public Records
Tax History
| Year | Tax Paid | Tax Assessment Tax Assessment Total Assessment is a certain percentage of the fair market value that is determined by local assessors to be the total taxable value of land and additions on the property. | Land | Improvement |
|---|---|---|---|---|
| 2025 | $5,818 | $419,200 | $109,900 | $309,300 |
| 2024 | $5,705 | $419,200 | $109,900 | $309,300 |
| 2023 | $5,489 | $290,400 | $75,800 | $214,600 |
| 2022 | $5,375 | $290,400 | $75,800 | $214,600 |
| 2021 | $5,227 | $290,400 | $75,800 | $214,600 |
| 2020 | $5,217 | $251,200 | $79,400 | $171,800 |
| 2019 | $5,217 | $251,200 | $79,400 | $171,800 |
| 2018 | $5,097 | $251,200 | $79,400 | $171,800 |
| 2017 | $5,217 | $227,400 | $72,200 | $155,200 |
| 2016 | $5,195 | $231,400 | $72,200 | $159,200 |
| 2015 | $5,195 | $231,400 | $72,200 | $159,200 |
| 2014 | $4,721 | $206,700 | $72,200 | $134,500 |
Source: Public Records
Map
Nearby Homes
- 50 Briarwood Rd
- 1027 Providence St Unit 4B
- 42 Woodland Dr
- 61 Crossland Rd
- 0 Natick Rd
- 25 Wilson St
- 12 Railroad Row
- 63 Governors Hill Unit 63
- 14 Amanda St
- 15 Gilcrest Dr
- 550 Wakefield St Unit 2
- 14 W Natick Rd
- 46 Hornbeam Dr
- 78 Wilbur Ave
- 52 Cottonwood Dr
- 9 Odonnell Ave
- 52 Jambray Ave
- 1715 Phenix Ave
- 567 Providence St
- 36 Bleachery Ct
Your Personal Tour Guide
Ask me questions while you tour the home.