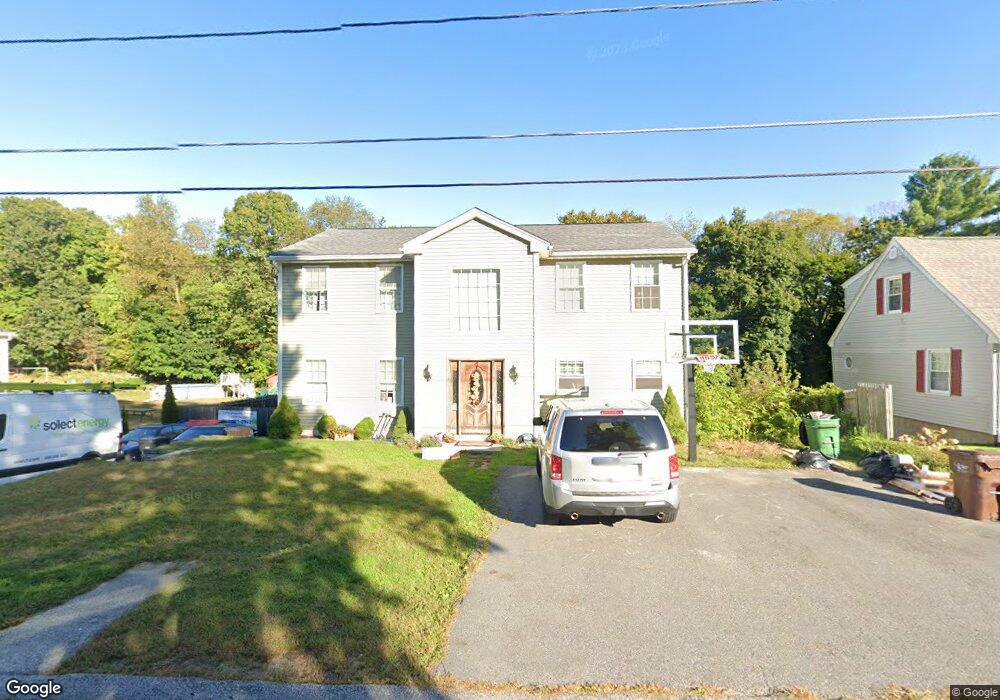
20 Chestnut Ave Auburn, MA 01501
Stoneville NeighborhoodEstimated Value: $546,000 - $619,000
3
Beds
1
Bath
1,500
Sq Ft
$391/Sq Ft
Est. Value
About This Home
This home is located at 20 Chestnut Ave, Auburn, MA 01501 and is currently estimated at $587,174, approximately $391 per square foot. 20 Chestnut Ave is a home located in Worcester County with nearby schools including Auburn Senior High School, Canterbury Street School, and Shrewsbury Montessori School - Auburn Campus.
Ownership History
Date
Name
Owned For
Owner Type
Purchase Details
Closed on
Dec 23, 2005
Sold by
Ellis Linda M
Bought by
Ellis Benjamin
Current Estimated Value
Home Financials for this Owner
Home Financials are based on the most recent Mortgage that was taken out on this home.
Original Mortgage
$208,000
Outstanding Balance
$116,861
Interest Rate
6.36%
Mortgage Type
Purchase Money Mortgage
Estimated Equity
$470,313
Purchase Details
Closed on
Apr 25, 2005
Sold by
Ellis Linda M and Ellis Randy N
Bought by
Ellis Linda M
Home Financials for this Owner
Home Financials are based on the most recent Mortgage that was taken out on this home.
Original Mortgage
$114,000
Interest Rate
5.87%
Mortgage Type
Purchase Money Mortgage
Create a Home Valuation Report for This Property
The Home Valuation Report is an in-depth analysis detailing your home's value as well as a comparison with similar homes in the area
Home Values in the Area
Average Home Value in this Area
Purchase History
We collect this data history from publicly available records. To have your information removed, we recommend requesting removal directly through your county’s website.
| Date | Buyer | Sale Price | Title Company |
|---|---|---|---|
| Ellis Benjamin | $260,000 | -- | |
| Ellis Linda M | -- | -- |
Source: Public Records
Mortgage History
We collect this data history from publicly available records. To have your information removed, we recommend requesting removal directly through your county’s website.
| Date | Status | Borrower | Loan Amount |
|---|---|---|---|
| Open | Ellis Benjamin | $208,000 | |
| Previous Owner | Ellis Linda M | $114,000 |
Source: Public Records
Tax History
| Year | Tax Paid | Tax Assessment Tax Assessment Total Assessment is a certain percentage of the fair market value that is determined by local assessors to be the total taxable value of land and additions on the property. | Land | Improvement |
|---|---|---|---|---|
| 2025 | $7,885 | $551,800 | $115,000 | $436,800 |
| 2024 | $8,094 | $542,100 | $109,700 | $432,400 |
| 2023 | $7,721 | $486,200 | $99,700 | $386,500 |
| 2022 | $7,068 | $420,200 | $99,700 | $320,500 |
| 2021 | $3,963 | $366,200 | $88,000 | $278,200 |
| 2020 | $6,584 | $366,200 | $88,000 | $278,200 |
| 2019 | $6,095 | $330,900 | $87,100 | $243,800 |
| 2018 | $5,997 | $325,200 | $81,500 | $243,700 |
| 2017 | $6,329 | $345,100 | $73,900 | $271,200 |
| 2016 | $6,208 | $343,200 | $77,300 | $265,900 |
| 2015 | $5,875 | $340,400 | $77,300 | $263,100 |
| 2014 | $5,728 | $331,300 | $73,600 | $257,700 |
Source: Public Records
Map
Nearby Homes
- 14 Chestnut Ave
- 14 Chestnut Ave Unit 2
- 16 Chestnut Ave
- 10 Chestnut Ave
- 6 Chestnut Ave Unit 10
- 166 Boyce St
- 172 Boyce St
- 13 & 15 Chestnut Ave
- 13 Chestnut Ave
- 17 Chestnut Ave
- 7 Chestnut Ave
- 24 Chestnut Ave
- 158 Boyce St
- 4 Commonwealth Ave
- 156 Boyce St
- 26 Chestnut Ave
- 5 Chestnut Ave
- 180 Boyce St
- 27 Chestnut Ave
- 175 Boyce St
Your Personal Tour Guide
Ask me questions while you tour the home.