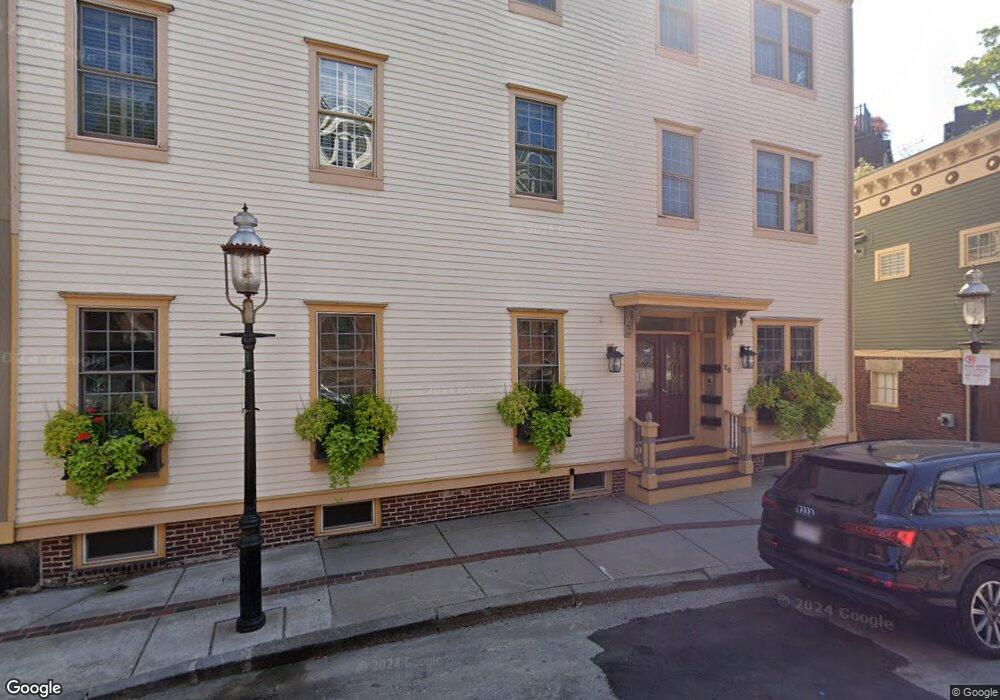
20 Chestnut St Unit 3 Charlestown, MA 02129
Thompson Square-Bunker Hill NeighborhoodEstimated Value: $645,654 - $725,000
1
Bed
1
Bath
695
Sq Ft
$988/Sq Ft
Est. Value
About This Home
This home is located at 20 Chestnut St Unit 3, Charlestown, MA 02129 and is currently estimated at $686,664, approximately $988 per square foot. 20 Chestnut St Unit 3 is a home located in Suffolk County with nearby schools including Boston Children's School and St John School.
Ownership History
Date
Name
Owned For
Owner Type
Purchase Details
Closed on
Aug 14, 2015
Sold by
20 Chestnut Street Llc
Bought by
Hill Matthew
Current Estimated Value
Home Financials for this Owner
Home Financials are based on the most recent Mortgage that was taken out on this home.
Original Mortgage
$407,400
Outstanding Balance
$320,961
Interest Rate
4.08%
Mortgage Type
New Conventional
Estimated Equity
$365,703
Purchase Details
Closed on
Oct 16, 2007
Sold by
18 Chestnut Street Nt
Bought by
20 Chestnut Street Llc
Purchase Details
Closed on
Nov 25, 2005
Sold by
Stewart Margaret
Bought by
Coen Theresa A
Purchase Details
Closed on
Sep 15, 1989
Sold by
Kearney Mark
Bought by
Stewart Margaret A
Home Financials for this Owner
Home Financials are based on the most recent Mortgage that was taken out on this home.
Original Mortgage
$133,600
Interest Rate
9.58%
Mortgage Type
Purchase Money Mortgage
Create a Home Valuation Report for This Property
The Home Valuation Report is an in-depth analysis detailing your home's value as well as a comparison with similar homes in the area
Home Values in the Area
Average Home Value in this Area
Purchase History
| Date | Buyer | Sale Price | Title Company |
|---|---|---|---|
| Hill Matthew | $420,000 | -- | |
| 20 Chestnut Street Llc | -- | -- | |
| Coen Theresa A | $321,500 | -- | |
| Stewart Margaret A | $148,500 | -- |
Source: Public Records
Mortgage History
| Date | Status | Borrower | Loan Amount |
|---|---|---|---|
| Open | Hill Matthew | $407,400 | |
| Previous Owner | Stewart Margaret A | $133,600 |
Source: Public Records
Tax History Compared to Growth
Tax History
| Year | Tax Paid | Tax Assessment Tax Assessment Total Assessment is a certain percentage of the fair market value that is determined by local assessors to be the total taxable value of land and additions on the property. | Land | Improvement |
|---|---|---|---|---|
| 2025 | $6,416 | $554,100 | $0 | $554,100 |
| 2024 | $5,805 | $532,600 | $0 | $532,600 |
| 2023 | $5,443 | $506,800 | $0 | $506,800 |
| 2022 | $5,302 | $487,300 | $0 | $487,300 |
| 2021 | $5,097 | $477,700 | $0 | $477,700 |
| 2020 | $5,521 | $522,800 | $0 | $522,800 |
| 2019 | $5,148 | $488,400 | $0 | $488,400 |
| 2018 | $4,875 | $465,200 | $0 | $465,200 |
| 2017 | $4,780 | $451,400 | $0 | $451,400 |
| 2016 | $4,884 | $444,000 | $0 | $444,000 |
| 2015 | $4,407 | $363,900 | $0 | $363,900 |
| 2014 | $4,077 | $324,100 | $0 | $324,100 |
Source: Public Records
Map
Nearby Homes
- 5 Wallace Ct
- 73 Chelsea St Unit 401
- 12 Prospect St Unit 2
- 12 Prospect St Unit 1
- 17 Henley St Unit F
- 17 Henley St Unit B
- 106 Bunker Hill St Unit 2
- 106 Bunker Hill St Unit 6
- 106 Bunker Hill St Unit 1
- 106 Bunker Hill St Unit 4P
- 106 Bunker Hill St Unit 3
- 46 High St
- 22 Harvard St
- 56 High St Unit 3
- 172 Bunker Hill St Unit 1
- 1 Washington Place
- 42 8th St Unit 5316
- 42 8th St Unit 4209
- 42 8th St Unit 4106
- 42 8th St Unit 1201
- 20 Adams St Unit 3
- 20 Adams St Unit 2
- 20 Adams St Unit 1
- 20 Chestnut St Unit 2
- 20 Chestnut St Unit 1
- 14 Adams St
- 14 Adams St Unit 1
- 27 Common St
- 18 Chestnut St
- 20 Ellwood St
- 20 Ellwood St Unit 2
- 16 Chestnut St
- 19 Ellwood St
- 26 Common St
- 26 Common St Unit 2
- 23 Common St
- 14 Chestnut St
- 17 Ellwood St Unit 3
- 17 Ellwood St Unit 2
- 17 Ellwood St Unit 1