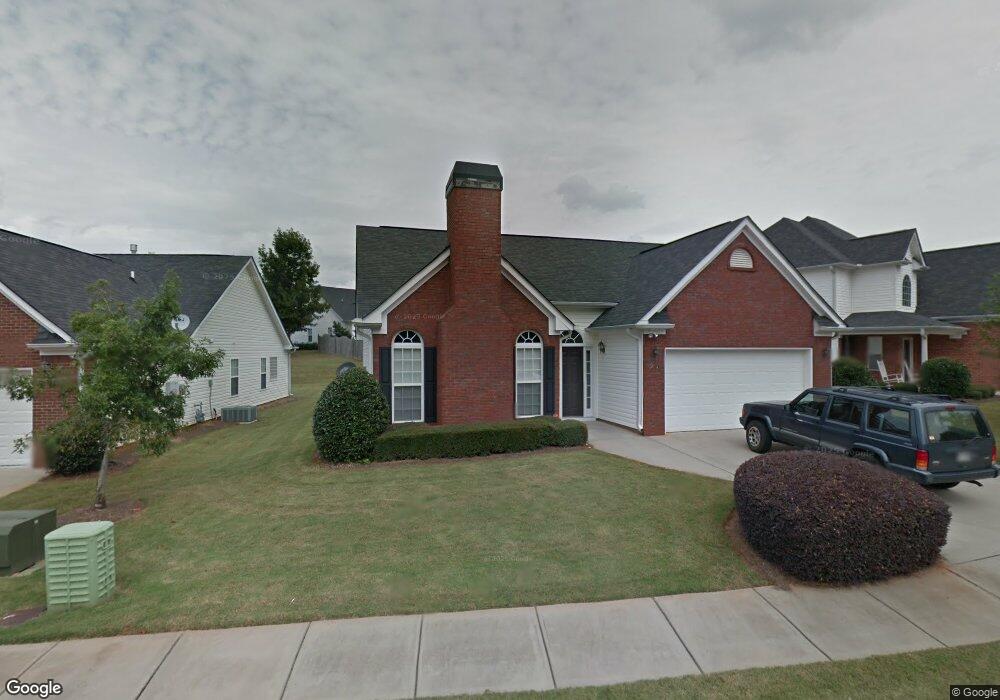
20 Claiborne Trail Unit 10 Newnan, GA 30263
Estimated Value: $290,259 - $317,000
3
Beds
2
Baths
1,431
Sq Ft
$215/Sq Ft
Est. Value
About This Home
This home is located at 20 Claiborne Trail Unit 10, Newnan, GA 30263 and is currently estimated at $307,065, approximately $214 per square foot. 20 Claiborne Trail Unit 10 is a home located in Coweta County with nearby schools including Jefferson Parkway Elementary School, Madras Middle School, and Northgate High School.
Ownership History
Date
Name
Owned For
Owner Type
Purchase Details
Closed on
Sep 15, 2017
Sold by
Boren Riewa Lott
Bought by
Colony Thirteen Properties Llc
Current Estimated Value
Purchase Details
Closed on
May 8, 2012
Sold by
Secretary Of Housing And U
Bought by
Boren Riewa Lott
Purchase Details
Closed on
Nov 1, 2011
Sold by
Midfirst Bank
Bought by
Secretary Of Housing And Urban and C/O Us Dept Of Hud
Purchase Details
Closed on
May 13, 2005
Sold by
Russell Robin K
Bought by
Johnson Curtis and Johnson Elizabeth
Home Financials for this Owner
Home Financials are based on the most recent Mortgage that was taken out on this home.
Original Mortgage
$141,775
Interest Rate
5.8%
Mortgage Type
VA
Purchase Details
Closed on
Feb 25, 2003
Sold by
Churchill Park Venture Inc
Bought by
Richard E Perry Homes Inc
Purchase Details
Closed on
Jul 25, 2002
Sold by
Parkway Ventures Inc
Bought by
Churchill Park Venture Inc
Create a Home Valuation Report for This Property
The Home Valuation Report is an in-depth analysis detailing your home's value as well as a comparison with similar homes in the area
Home Values in the Area
Average Home Value in this Area
Purchase History
| Date | Buyer | Sale Price | Title Company |
|---|---|---|---|
| Colony Thirteen Properties Llc | $165,000 | -- | |
| Boren Riewa Lott | $101,065 | -- | |
| Secretary Of Housing And Urban | $137,424 | -- | |
| Midfirst Bank | $137,424 | -- | |
| Johnson Curtis | $144,000 | -- | |
| Richard E Perry Homes Inc | $150,000 | -- | |
| Churchill Park Venture Inc | $1,023,000 | -- |
Source: Public Records
Mortgage History
| Date | Status | Borrower | Loan Amount |
|---|---|---|---|
| Previous Owner | Johnson Curtis | $141,775 |
Source: Public Records
Tax History Compared to Growth
Tax History
| Year | Tax Paid | Tax Assessment Tax Assessment Total Assessment is a certain percentage of the fair market value that is determined by local assessors to be the total taxable value of land and additions on the property. | Land | Improvement |
|---|---|---|---|---|
| 2024 | $2,547 | $111,469 | $22,000 | $89,469 |
| 2023 | $2,547 | $113,390 | $22,000 | $91,390 |
| 2022 | $2,095 | $86,112 | $22,000 | $64,112 |
| 2021 | $1,902 | $70,755 | $16,000 | $54,755 |
| 2020 | $1,945 | $70,755 | $16,000 | $54,755 |
| 2019 | $1,868 | $62,181 | $10,000 | $52,181 |
| 2018 | $1,879 | $62,181 | $10,000 | $52,181 |
| 2017 | $1,690 | $56,160 | $10,000 | $46,160 |
| 2016 | $1,691 | $56,160 | $10,000 | $46,160 |
| 2015 | $1,573 | $52,146 | $10,000 | $42,146 |
| 2014 | $1,248 | $46,126 | $10,000 | $36,126 |
Source: Public Records
Map
Nearby Homes
- 9 Bluegrass Pass
- 21 Riva Ridge Ln
- 67 Seabiscuit Ct
- 63 Seabiscuit Ct
- 21 Mill Ridge Place
- 62 Seabiscuit Ct
- 27 Churchill Park Dr
- 350 Brentwood Dr Unit 25
- 380 Brentwood Dr Unit 28
- 33 Churchill Park Dr
- 10 Camellia Cir
- 6 Lynn Cir
- 7 Red Bud Trail
- 4 Golf Ln
- 8 Hardin Ct Unit LOT 16
- 17 Cloverhurst Dr Unit LOT 14
- 15 Cloverhurst Dr Unit LOT 15
- 8 Pine Ridge Dr
- 367 Old Atlanta Hwy Unit LOT 4
- 371 Old Atlanta Hwy Unit LOT 5
- 20 Claiborne Trail
- 18 Claiborne Trail
- 22 Claiborne Trail
- 0 Claiborne Trail Unit 8725184
- 0 Claiborne Trail Unit 3228831
- 0 Claiborne Trail Unit 8883287
- 0 Claiborne Trail Unit 8841336
- 0 Claiborne Trail Unit 8832960
- 0 Claiborne Trail Unit 8630594
- 0 Claiborne Trail Unit 8671414
- 0 Claiborne Trail Unit 8469477
- 0 Claiborne Trail Unit 8233287
- 0 Claiborne Trail Unit 8261441
- 0 Claiborne Trail Unit 8031319
- 0 Claiborne Trail Unit 8029914
- 0 Claiborne Trail Unit 7227230
- 0 Claiborne Trail Unit 7156759
- 0 Claiborne Trail Unit 9042475
- 0 Claiborne Trail Unit 9054553
- 0 Claiborne Trail Unit 3153867