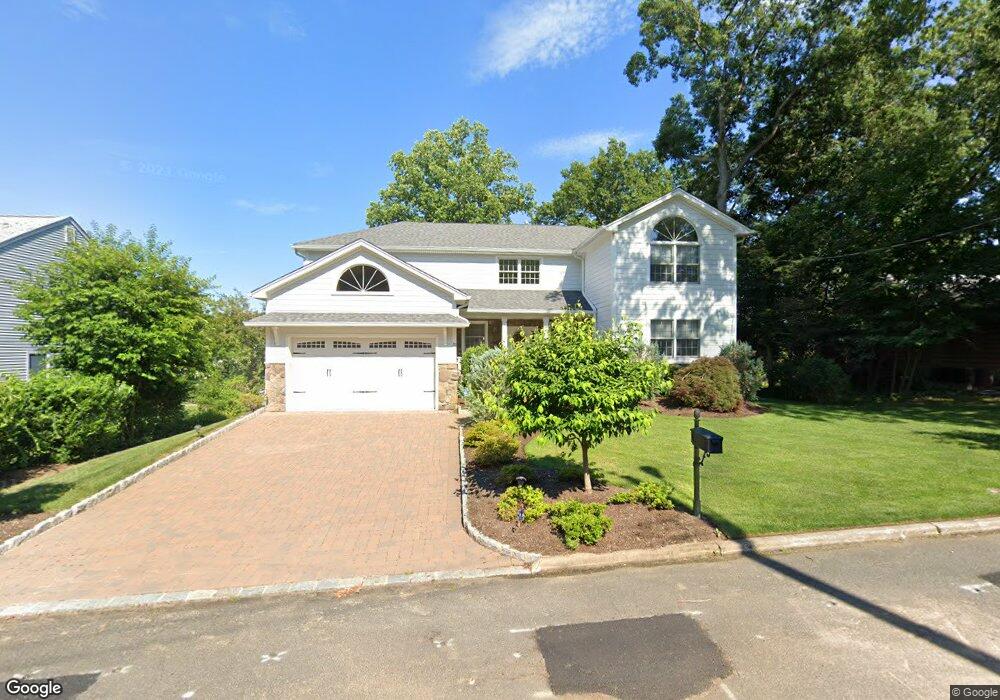
20 Clark St Cresskill, NJ 07626
Estimated Value: $1,478,000 - $1,717,000
--
Bed
--
Bath
2,964
Sq Ft
$544/Sq Ft
Est. Value
About This Home
This home is located at 20 Clark St, Cresskill, NJ 07626 and is currently estimated at $1,611,070, approximately $543 per square foot. 20 Clark St is a home located in Bergen County with nearby schools including Cresskill High School.
Ownership History
Date
Name
Owned For
Owner Type
Purchase Details
Closed on
Sep 24, 2014
Sold by
Cresswood Homes Llc
Bought by
Mastropasqua Angelo and Peynado Castro Laura Del Pilar
Current Estimated Value
Home Financials for this Owner
Home Financials are based on the most recent Mortgage that was taken out on this home.
Original Mortgage
$740,000
Outstanding Balance
$565,470
Interest Rate
4.09%
Mortgage Type
New Conventional
Estimated Equity
$1,045,600
Purchase Details
Closed on
Feb 28, 2013
Sold by
Kelly Chrisann
Bought by
Cresswood Homes Llc
Create a Home Valuation Report for This Property
The Home Valuation Report is an in-depth analysis detailing your home's value as well as a comparison with similar homes in the area
Home Values in the Area
Average Home Value in this Area
Purchase History
| Date | Buyer | Sale Price | Title Company |
|---|---|---|---|
| Mastropasqua Angelo | $925,000 | Fidelity National Title | |
| Cresswood Homes Llc | $350,000 | -- |
Source: Public Records
Mortgage History
| Date | Status | Borrower | Loan Amount |
|---|---|---|---|
| Open | Mastropasqua Angelo | $740,000 |
Source: Public Records
Tax History Compared to Growth
Tax History
| Year | Tax Paid | Tax Assessment Tax Assessment Total Assessment is a certain percentage of the fair market value that is determined by local assessors to be the total taxable value of land and additions on the property. | Land | Improvement |
|---|---|---|---|---|
| 2025 | $21,691 | $1,002,300 | $369,100 | $633,200 |
| 2024 | $20,966 | $943,100 | $331,400 | $611,700 |
| 2023 | $20,667 | $903,300 | $306,400 | $596,900 |
| 2022 | $20,667 | $858,600 | $283,700 | $574,900 |
| 2021 | $20,293 | $831,000 | $271,200 | $559,800 |
| 2020 | $19,806 | $814,400 | $262,700 | $551,700 |
| 2019 | $19,323 | $802,800 | $259,200 | $543,600 |
| 2018 | $13,405 | $795,100 | $256,200 | $538,900 |
| 2017 | $16,890 | $620,500 | $213,600 | $406,900 |
| 2016 | $16,387 | $620,500 | $213,600 | $406,900 |
| 2015 | $15,879 | $615,900 | $213,600 | $402,300 |
| 2014 | $15,287 | $307,000 | $213,600 | $93,400 |
Source: Public Records
Map
Nearby Homes