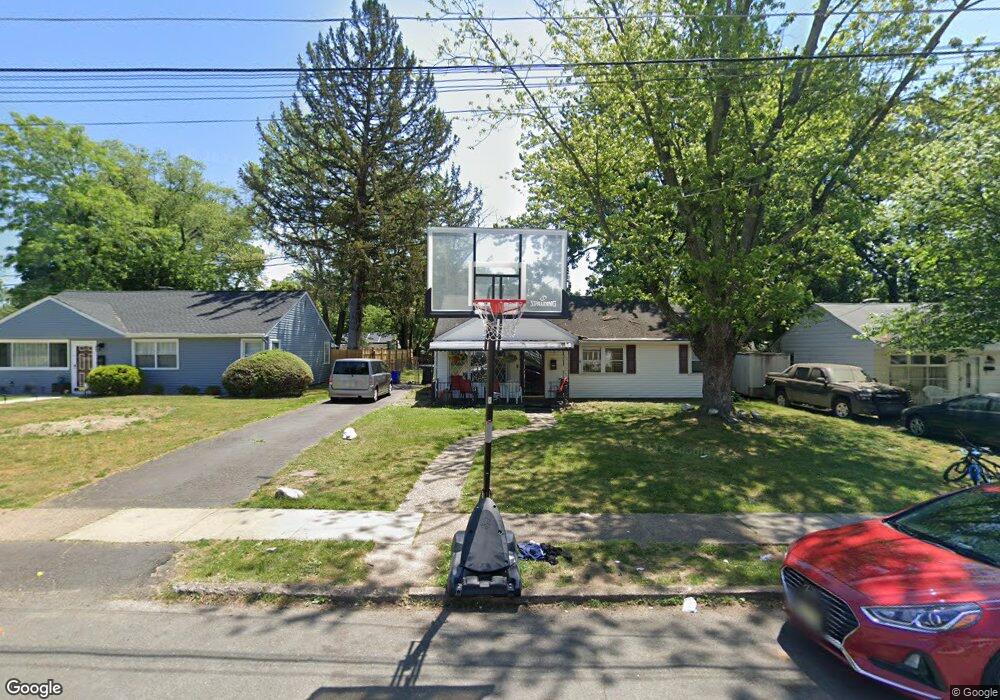
20 Conway Ave Ewing, NJ 08618
Parkway Village NeighborhoodEstimated Value: $250,000 - $346,000
3
Beds
2
Baths
1,232
Sq Ft
$248/Sq Ft
Est. Value
About This Home
This home is located at 20 Conway Ave, Ewing, NJ 08618 and is currently estimated at $306,150, approximately $248 per square foot. 20 Conway Ave is a home located in Mercer County with nearby schools including Ewing High School, The Village Charter School, and Trenton Stem-To-Civics Charter School.
Ownership History
Date
Name
Owned For
Owner Type
Purchase Details
Closed on
Feb 27, 2018
Sold by
Witcher Susan A
Bought by
Payton Angela N
Current Estimated Value
Home Financials for this Owner
Home Financials are based on the most recent Mortgage that was taken out on this home.
Original Mortgage
$110,400
Outstanding Balance
$95,675
Interest Rate
4.87%
Mortgage Type
FHA
Estimated Equity
$210,475
Purchase Details
Closed on
Feb 22, 2001
Sold by
Hutchings Peter
Bought by
Witcher Susan
Home Financials for this Owner
Home Financials are based on the most recent Mortgage that was taken out on this home.
Original Mortgage
$93,800
Interest Rate
7.15%
Purchase Details
Closed on
Apr 21, 1989
Sold by
Fletcher Gloria R
Bought by
Hutchings Peter J and Hutchings Anna M
Create a Home Valuation Report for This Property
The Home Valuation Report is an in-depth analysis detailing your home's value as well as a comparison with similar homes in the area
Home Values in the Area
Average Home Value in this Area
Purchase History
We collect this data history from publicly available records. To have your information removed, we recommend requesting removal directly through your county’s website.
| Date | Buyer | Sale Price | Title Company |
|---|---|---|---|
| Payton Angela N | $112,500 | Dominion Title Svcs | |
| Witcher Susan | $98,750 | -- | |
| -- | $98,800 | -- | |
| Hutchings Peter J | $99,900 | -- |
Source: Public Records
Mortgage History
We collect this data history from publicly available records. To have your information removed, we recommend requesting removal directly through your county’s website.
| Date | Status | Borrower | Loan Amount |
|---|---|---|---|
| Open | Payton Angela N | $110,400 | |
| Previous Owner | -- | $93,800 |
Source: Public Records
Tax History
| Year | Tax Paid | Tax Assessment Tax Assessment Total Assessment is a certain percentage of the fair market value that is determined by local assessors to be the total taxable value of land and additions on the property. | Land | Improvement |
|---|---|---|---|---|
| 2025 | $5,483 | $139,400 | $44,000 | $95,400 |
| 2024 | $5,154 | $139,400 | $44,000 | $95,400 |
| 2023 | $5,154 | $139,400 | $44,000 | $95,400 |
| 2022 | $5,014 | $139,400 | $44,000 | $95,400 |
| 2021 | $4,892 | $139,400 | $44,000 | $95,400 |
| 2020 | $4,822 | $139,400 | $44,000 | $95,400 |
| 2019 | $4,696 | $139,400 | $44,000 | $95,400 |
| 2018 | $4,632 | $87,700 | $30,700 | $57,000 |
| 2017 | $4,740 | $87,700 | $30,700 | $57,000 |
| 2016 | $4,676 | $87,700 | $30,700 | $57,000 |
| 2015 | $4,614 | $87,700 | $30,700 | $57,000 |
| 2014 | $4,602 | $87,700 | $30,700 | $57,000 |
Source: Public Records
Map
Nearby Homes
- 10 Great Woods Dr
- 1183 Lower Ferry Rd
- 41 Harding St
- 53 Carlton Ave
- 14 van Duyn Dr
- 1005 Terrace Blvd
- 33 Stratford Ave
- 126 Rutledge Ave
- 20 Steinway Ave
- 1108 Lower Ferry Rd
- 27 Walton Ave
- 1205 Parkway Ave
- 13 Hickory Hill Dr
- 22 Farrell Ave
- 27 Bayberry Rd
- 2 Rockleigh Dr
- 1 Sussex St
- 89 Upper Ferry Rd
- 104 King Ave
- 261 Upper Ferry Rd
Your Personal Tour Guide
Ask me questions while you tour the home.