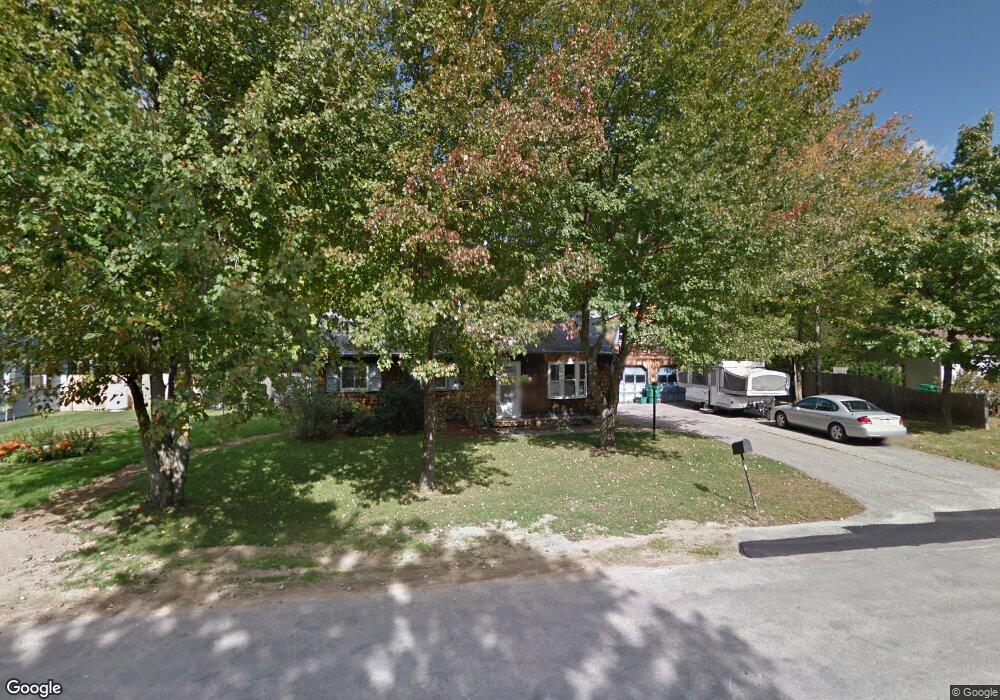
20 Corson St Rochester, NH 03867
Estimated Value: $404,000 - $436,000
4
Beds
1
Bath
1,660
Sq Ft
$249/Sq Ft
Est. Value
About This Home
This home is located at 20 Corson St, Rochester, NH 03867 and is currently estimated at $413,452, approximately $249 per square foot. 20 Corson St is a home located in Strafford County with nearby schools including Chamberlain Street School, Rochester Middle School, and Spaulding High School.
Ownership History
Date
Name
Owned For
Owner Type
Purchase Details
Closed on
Jan 9, 2013
Sold by
Stpierre Melissa A
Bought by
Stpierre Melissa A and Stpiere Jason J
Current Estimated Value
Home Financials for this Owner
Home Financials are based on the most recent Mortgage that was taken out on this home.
Original Mortgage
$86,500
Outstanding Balance
$59,688
Interest Rate
3.36%
Mortgage Type
New Conventional
Estimated Equity
$353,764
Purchase Details
Closed on
Jan 20, 1994
Bought by
Stpierre Melissa A and Stpiere Jason J
Create a Home Valuation Report for This Property
The Home Valuation Report is an in-depth analysis detailing your home's value as well as a comparison with similar homes in the area
Home Values in the Area
Average Home Value in this Area
Purchase History
| Date | Buyer | Sale Price | Title Company |
|---|---|---|---|
| Stpierre Melissa A | $65,000 | -- | |
| Stpierre Melissa A | -- | -- |
Source: Public Records
Mortgage History
| Date | Status | Borrower | Loan Amount |
|---|---|---|---|
| Open | Stpierre Melissa A | $86,500 | |
| Closed | Stpierre Melissa A | $20,000 |
Source: Public Records
Tax History Compared to Growth
Tax History
| Year | Tax Paid | Tax Assessment Tax Assessment Total Assessment is a certain percentage of the fair market value that is determined by local assessors to be the total taxable value of land and additions on the property. | Land | Improvement |
|---|---|---|---|---|
| 2024 | $4,905 | $330,300 | $82,500 | $247,800 |
| 2023 | $4,520 | $175,600 | $53,900 | $121,700 |
| 2022 | $4,439 | $175,600 | $53,900 | $121,700 |
| 2021 | $4,329 | $175,600 | $53,900 | $121,700 |
| 2020 | $4,326 | $175,800 | $53,900 | $121,900 |
| 2019 | $4,377 | $175,800 | $53,900 | $121,900 |
| 2018 | $4,602 | $169,000 | $40,400 | $128,600 |
| 2017 | $4,450 | $169,000 | $40,400 | $128,600 |
| 2016 | $4,146 | $146,700 | $40,400 | $106,300 |
| 2015 | $4,130 | $146,700 | $40,400 | $106,300 |
| 2014 | $3,772 | $137,300 | $40,400 | $96,900 |
| 2013 | $3,912 | $148,400 | $53,900 | $94,500 |
| 2012 | $3,811 | $148,400 | $53,900 | $94,500 |
Source: Public Records
Map
Nearby Homes
- 22 Corson St
- 56 Chamberlain St
- 0 Franklin St Unit 55 4959653
- 35 Franklin Heights
- 32 Adams Ave
- 518 & 532 Portland St
- 38 Western Ave
- 68 Moose Ln
- 67 Winter St
- 10 Sarah Ct
- 10 Lady Slipper Ct
- 1 Farrington St
- 616 Portland St Unit 75
- 17 Winter St
- 47 Hanson St
- 45 Hanson St
- 15 Linden St
- 3 Dodge St
- 2 Freedom Dr
- 3 Freedom Dr Unit 17