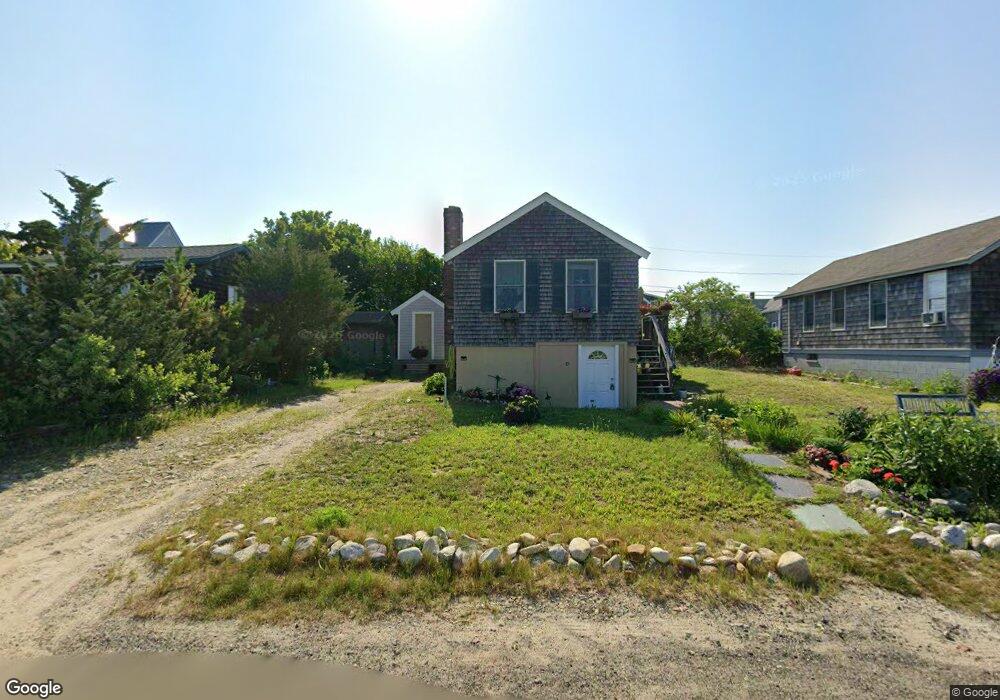
20 Cove St Brant Rock, MA 02020
Ocean Bluff-Brant Rock NeighborhoodEstimated Value: $949,000 - $1,251,000
4
Beds
2
Baths
2,020
Sq Ft
$535/Sq Ft
Est. Value
About This Home
This home is located at 20 Cove St, Brant Rock, MA 02020 and is currently estimated at $1,080,819, approximately $535 per square foot. 20 Cove St is a home with nearby schools including Governor Edward Winslow School, Furnace Brook Middle School, and Marshfield High School.
Ownership History
Date
Name
Owned For
Owner Type
Purchase Details
Closed on
Jun 19, 2009
Sold by
Bay Shore Rt
Bought by
Curtin John L and Whippen-Curtin Lauren A
Current Estimated Value
Home Financials for this Owner
Home Financials are based on the most recent Mortgage that was taken out on this home.
Original Mortgage
$328,800
Outstanding Balance
$209,304
Interest Rate
4.91%
Mortgage Type
Purchase Money Mortgage
Estimated Equity
$871,515
Purchase Details
Closed on
May 20, 2009
Sold by
Citibank Na
Bought by
Bay Shore Rt
Home Financials for this Owner
Home Financials are based on the most recent Mortgage that was taken out on this home.
Original Mortgage
$328,800
Outstanding Balance
$209,304
Interest Rate
4.91%
Mortgage Type
Purchase Money Mortgage
Estimated Equity
$871,515
Purchase Details
Closed on
Feb 27, 2009
Sold by
Junior Scott A
Bought by
Citibank Na and Wamu-He4 T
Purchase Details
Closed on
Nov 1, 2007
Sold by
Kma Rt
Bought by
Junior Scott A
Home Financials for this Owner
Home Financials are based on the most recent Mortgage that was taken out on this home.
Original Mortgage
$637,500
Interest Rate
6.43%
Mortgage Type
Purchase Money Mortgage
Create a Home Valuation Report for This Property
The Home Valuation Report is an in-depth analysis detailing your home's value as well as a comparison with similar homes in the area
Home Values in the Area
Average Home Value in this Area
Purchase History
| Date | Buyer | Sale Price | Title Company |
|---|---|---|---|
| Curtin John L | $411,000 | -- | |
| Bay Shore Rt | $370,000 | -- | |
| Citibank Na | $490,500 | -- | |
| Junior Scott A | -- | -- |
Source: Public Records
Mortgage History
| Date | Status | Borrower | Loan Amount |
|---|---|---|---|
| Open | Junior Scott A | $328,800 | |
| Previous Owner | Junior Scott A | $637,500 | |
| Previous Owner | Junior Scott A | $60,000 |
Source: Public Records
Tax History Compared to Growth
Tax History
| Year | Tax Paid | Tax Assessment Tax Assessment Total Assessment is a certain percentage of the fair market value that is determined by local assessors to be the total taxable value of land and additions on the property. | Land | Improvement |
|---|---|---|---|---|
| 2025 | $8,593 | $868,000 | $432,600 | $435,400 |
| 2024 | $7,883 | $758,700 | $381,100 | $377,600 |
| 2023 | $6,390 | $645,800 | $329,600 | $316,200 |
| 2022 | $6,390 | $493,400 | $242,100 | $251,300 |
| 2021 | $6,365 | $482,600 | $242,100 | $240,500 |
| 2020 | $6,084 | $456,400 | $226,600 | $229,800 |
| 2019 | $5,962 | $445,600 | $226,600 | $219,000 |
| 2018 | $5,958 | $445,600 | $226,600 | $219,000 |
| 2017 | $5,830 | $424,900 | $226,600 | $198,300 |
| 2016 | $5,759 | $414,900 | $226,600 | $188,300 |
| 2015 | $6,062 | $456,100 | $267,800 | $188,300 |
| 2014 | $5,890 | $443,200 | $267,800 | $175,400 |
Source: Public Records
Map
Nearby Homes