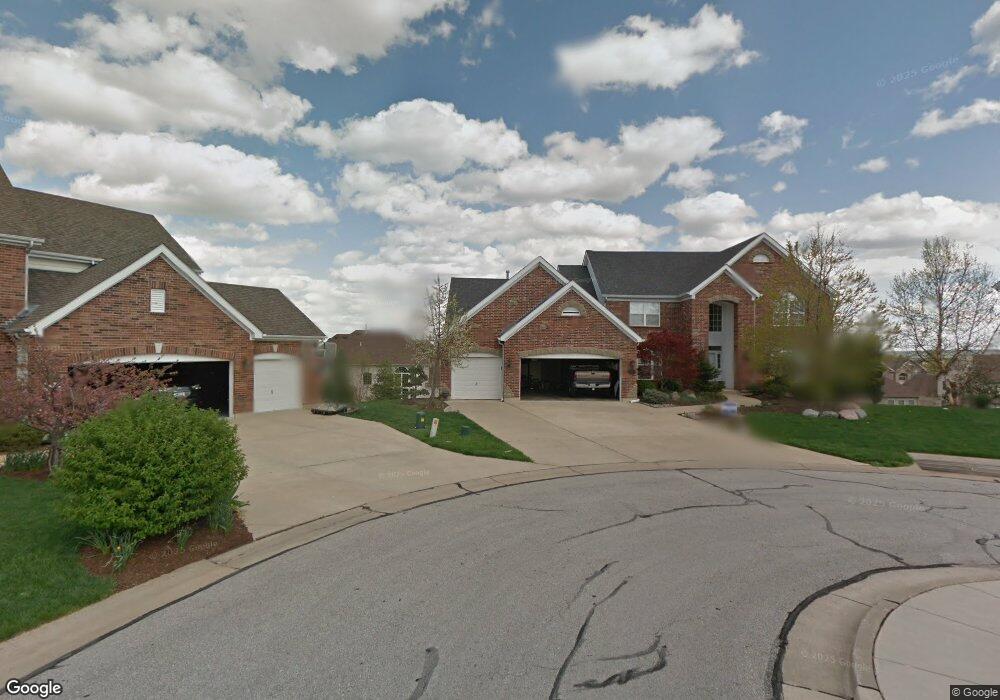
20 Crescent View Ct Saint Louis, MO 63129
Estimated Value: $630,000 - $726,000
4
Beds
4
Baths
3,844
Sq Ft
$177/Sq Ft
Est. Value
About This Home
This home is located at 20 Crescent View Ct, Saint Louis, MO 63129 and is currently estimated at $681,302, approximately $177 per square foot. 20 Crescent View Ct is a home located in St. Louis County with nearby schools including Point Elementary School, Oakville Middle School, and Oakville Senior High School.
Ownership History
Date
Name
Owned For
Owner Type
Purchase Details
Closed on
Oct 24, 2003
Sold by
Mcbride & Son Homes Inc
Bought by
Cepicky Charles and Cepicky Denise
Current Estimated Value
Home Financials for this Owner
Home Financials are based on the most recent Mortgage that was taken out on this home.
Original Mortgage
$230,000
Outstanding Balance
$105,487
Interest Rate
5.96%
Mortgage Type
Purchase Money Mortgage
Estimated Equity
$575,815
Create a Home Valuation Report for This Property
The Home Valuation Report is an in-depth analysis detailing your home's value as well as a comparison with similar homes in the area
Home Values in the Area
Average Home Value in this Area
Purchase History
| Date | Buyer | Sale Price | Title Company |
|---|---|---|---|
| Cepicky Charles | $454,625 | -- |
Source: Public Records
Mortgage History
| Date | Status | Borrower | Loan Amount |
|---|---|---|---|
| Open | Cepicky Charles | $230,000 |
Source: Public Records
Tax History Compared to Growth
Tax History
| Year | Tax Paid | Tax Assessment Tax Assessment Total Assessment is a certain percentage of the fair market value that is determined by local assessors to be the total taxable value of land and additions on the property. | Land | Improvement |
|---|---|---|---|---|
| 2025 | $7,119 | $126,540 | $24,070 | $102,470 |
| 2024 | $7,119 | $106,360 | $13,050 | $93,310 |
| 2023 | $7,029 | $106,360 | $13,050 | $93,310 |
| 2022 | $5,923 | $90,060 | $12,050 | $78,010 |
| 2021 | $5,732 | $90,060 | $12,050 | $78,010 |
| 2020 | $5,925 | $88,560 | $11,800 | $76,760 |
| 2019 | $5,907 | $88,560 | $11,800 | $76,760 |
| 2018 | $6,488 | $87,870 | $9,800 | $78,070 |
| 2017 | $6,479 | $87,870 | $9,800 | $78,070 |
| 2016 | $5,994 | $77,970 | $9,800 | $68,170 |
| 2015 | $5,500 | $77,970 | $9,800 | $68,170 |
| 2014 | $5,736 | $80,520 | $20,310 | $60,210 |
Source: Public Records
Map
Nearby Homes
- 6841 River Bow Ct
- 6834 Black Water Dr
- 6568 Devonhurst Dr
- 315 Buford Landing
- 2512 Janel Ct
- 160 River Breeze Way
- 120 River Breeze Way
- 2680 Cripple Creek Dr
- 100 River Breeze Way
- 6221 Water Tower Place Dr
- 6708 Bear Creek Dr
- 2581 Christopher Oaks Ct
- 6935 Bluff Springs Ct
- 2771 Cliffwood Trail
- 6116 Arbor Green Dr
- 2692 Queen Bee Ln
- 2995 Point Dr
- 156 Tori Pines Dr Unit 55
- 2503 River Winds Ct
- 2634 Brantley Ct
- 16 Crescent View Ct
- 310 Greycliff Bluff Dr
- 15 Crescent View Ct
- 306 Greycliff Bluff Dr
- 314 Greycliff Bluff Dr
- 12 Crescent View Ct
- 11 Crescent View Ct
- 180 Greycliff Manor Dr
- 302 Greycliff Bluff Dr
- 9 Norman Grove Ct
- 318 Greycliff Bluff Dr
- 15 Norman Grove Ct
- 176 Greycliff Manor Dr
- 7 Crescent View Ct
- 8 Crescent View Ct
- 309 Greycliff Bluff Dr
- 313 Greycliff Bluff Dr
- 172 Greycliff Manor Dr
- 5 Norman Grove Ct
- 305 Greycliff Bluff Dr