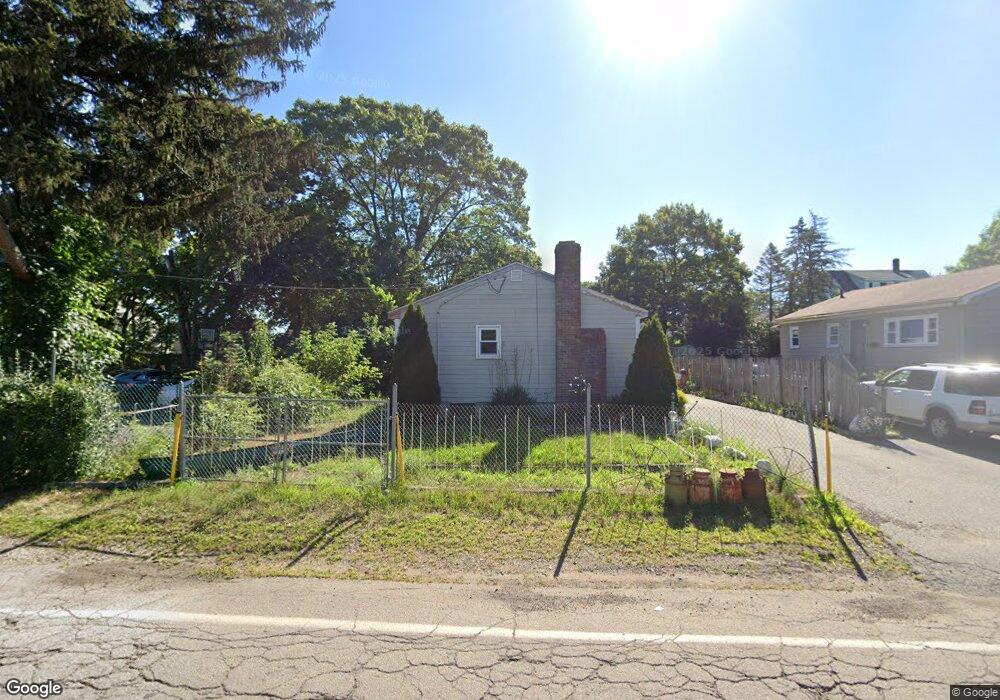
20 Curve St Brockton, MA 02302
Clifton Heights NeighborhoodEstimated Value: $393,000 - $428,000
3
Beds
1
Bath
900
Sq Ft
$455/Sq Ft
Est. Value
About This Home
This home is located at 20 Curve St, Brockton, MA 02302 and is currently estimated at $409,830, approximately $455 per square foot. 20 Curve St is a home located in Plymouth County with nearby schools including Gilmore Elementary School, Davis K-8 School, and John F. Kennedy Elementary School.
Ownership History
Date
Name
Owned For
Owner Type
Purchase Details
Closed on
Mar 22, 2005
Sold by
Lafleur Christine and Murray Eleanor V
Bought by
Lafleur Robert
Current Estimated Value
Home Financials for this Owner
Home Financials are based on the most recent Mortgage that was taken out on this home.
Original Mortgage
$156,000
Outstanding Balance
$79,245
Interest Rate
5.64%
Mortgage Type
Purchase Money Mortgage
Estimated Equity
$330,585
Create a Home Valuation Report for This Property
The Home Valuation Report is an in-depth analysis detailing your home's value as well as a comparison with similar homes in the area
Home Values in the Area
Average Home Value in this Area
Purchase History
| Date | Buyer | Sale Price | Title Company |
|---|---|---|---|
| Lafleur Robert | $195,000 | -- |
Source: Public Records
Mortgage History
| Date | Status | Borrower | Loan Amount |
|---|---|---|---|
| Open | Lafleur Robert | $156,000 | |
| Closed | Lafleur Robert | $29,250 |
Source: Public Records
Tax History
| Year | Tax Paid | Tax Assessment Tax Assessment Total Assessment is a certain percentage of the fair market value that is determined by local assessors to be the total taxable value of land and additions on the property. | Land | Improvement |
|---|---|---|---|---|
| 2025 | $4,690 | $387,300 | $140,200 | $247,100 |
| 2024 | $4,541 | $377,800 | $140,200 | $237,600 |
| 2023 | $4,473 | $344,600 | $104,900 | $239,700 |
| 2022 | $4,118 | $294,800 | $95,400 | $199,400 |
| 2021 | $4,089 | $282,000 | $79,400 | $202,600 |
| 2020 | $3,845 | $253,800 | $74,200 | $179,600 |
| 2019 | $4,016 | $258,400 | $72,400 | $186,000 |
| 2018 | $3,365 | $209,500 | $72,400 | $137,100 |
| 2017 | $2,983 | $185,300 | $72,400 | $112,900 |
| 2016 | $3,175 | $182,900 | $70,200 | $112,700 |
| 2015 | $2,924 | $161,100 | $70,200 | $90,900 |
| 2014 | $2,977 | $164,200 | $70,200 | $94,000 |
Source: Public Records
Map
Nearby Homes
Your Personal Tour Guide
Ask me questions while you tour the home.