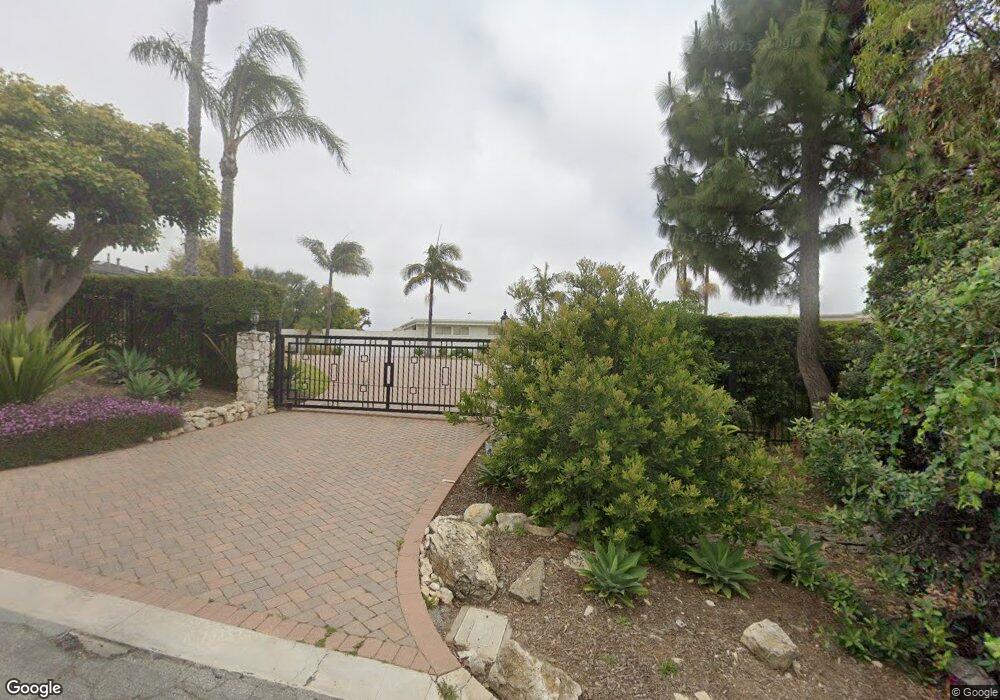
20 Diamonte Ln Rancho Palos Verdes, CA 90275
Estimated Value: $3,410,000 - $3,858,000
5
Beds
7
Baths
7,276
Sq Ft
$494/Sq Ft
Est. Value
About This Home
This home is located at 20 Diamonte Ln, Rancho Palos Verdes, CA 90275 and is currently estimated at $3,596,443, approximately $494 per square foot. 20 Diamonte Ln is a home located in Los Angeles County with nearby schools including Mira Catalina Elementary School, Miraleste Intermediate, and Palos Verdes Peninsula High School.
Ownership History
Date
Name
Owned For
Owner Type
Purchase Details
Closed on
May 16, 2007
Sold by
Karmelich Marie and Karmelich Brian
Bought by
Karmelich Marie A
Current Estimated Value
Purchase Details
Closed on
Nov 15, 2005
Sold by
Karmelich Marie and The Karmelich Family Trust
Bought by
Karmelich Marie
Purchase Details
Closed on
Apr 26, 1995
Sold by
Karmelich Mark
Bought by
Karmelich Ben
Purchase Details
Closed on
Dec 1, 1993
Sold by
Karmelich Ben and Karmelich Marie
Bought by
Karmelich Ben
Home Financials for this Owner
Home Financials are based on the most recent Mortgage that was taken out on this home.
Original Mortgage
$630,000
Interest Rate
6.37%
Purchase Details
Closed on
Oct 27, 1993
Sold by
United California Svgs Bank
Bought by
Karmelich Ben and Karmelich Marie
Home Financials for this Owner
Home Financials are based on the most recent Mortgage that was taken out on this home.
Original Mortgage
$630,000
Interest Rate
6.37%
Create a Home Valuation Report for This Property
The Home Valuation Report is an in-depth analysis detailing your home's value as well as a comparison with similar homes in the area
Home Values in the Area
Average Home Value in this Area
Purchase History
| Date | Buyer | Sale Price | Title Company |
|---|---|---|---|
| Karmelich Marie A | -- | None Available | |
| Karmelich Marie | -- | -- | |
| Karmelich Ben | -- | -- | |
| Karmelich Ben | -- | -- | |
| Karmelich Ben | $900,000 | -- |
Source: Public Records
Mortgage History
| Date | Status | Borrower | Loan Amount |
|---|---|---|---|
| Previous Owner | Karmelich Ben | $630,000 |
Source: Public Records
Tax History Compared to Growth
Tax History
| Year | Tax Paid | Tax Assessment Tax Assessment Total Assessment is a certain percentage of the fair market value that is determined by local assessors to be the total taxable value of land and additions on the property. | Land | Improvement |
|---|---|---|---|---|
| 2025 | $19,449 | $1,699,688 | $679,871 | $1,019,817 |
| 2024 | $19,449 | $1,666,362 | $666,541 | $999,821 |
| 2023 | $19,136 | $1,633,689 | $653,472 | $980,217 |
| 2022 | $18,128 | $1,601,657 | $640,659 | $960,998 |
| 2021 | $18,035 | $1,570,253 | $628,098 | $942,155 |
| 2019 | $17,249 | $1,523,680 | $609,469 | $914,211 |
| 2018 | $16,990 | $1,493,805 | $597,519 | $896,286 |
| 2016 | $16,082 | $1,435,800 | $574,317 | $861,483 |
| 2015 | $16,084 | $1,414,234 | $565,691 | $848,543 |
| 2014 | $15,866 | $1,386,532 | $554,610 | $831,922 |
Source: Public Records
Map
Nearby Homes
- 3423 Newridge Dr
- 3111 Deluna Dr
- 8 Via Subida
- 30040 Grandpoint Ln
- 29857 Knoll View Dr
- 6337 Via Colinita
- 2805 Calle Aventura
- 29815 Knoll View Dr
- 30679 Palos Verdes Dr E
- 6309 Via Colinita
- 2741 Vista Mesa Dr
- 4329 Via Frascati
- 2704 Vista Mesa Dr
- 6401 Corsini Place
- 30229 Kingsridge Dr
- 2063 Chandeleur Dr
- 29702 Grandpoint Ln
- 3316 Narino Dr
- 2046 Chandeleur Dr
- 314 S Miraleste Dr Unit 116
- 6 Diamonte Ln
- 30306 Diamonte Ln
- 30311 Palos Verdes Dr E
- 6480 Palos Verdes Dr E
- 30323 Palos Verdes Dr E
- 4 Diamonte Ln
- 30259 Palos Verdes Dr E
- 30321 Diamonte Ln
- 3 Diamonte Ln
- 17 Diamonte Ln
- 5 Diamonte Ln
- 30357 Diamonte Ln
- 6112 Via Subida
- 2 Diamonte Ln
- 30399 Palos Verdes Dr E
- 30404 Diamonte Ln
- 9 Diamonte Ln
- 3059 Deluna Dr
- 1 Diamonte Ln
- 30357 Palos Verdes Dr E