20 Dolloff St Laconia, NH 03246
Estimated Value: $359,000 - $367,368
3
Beds
2
Baths
1,564
Sq Ft
$232/Sq Ft
Est. Value
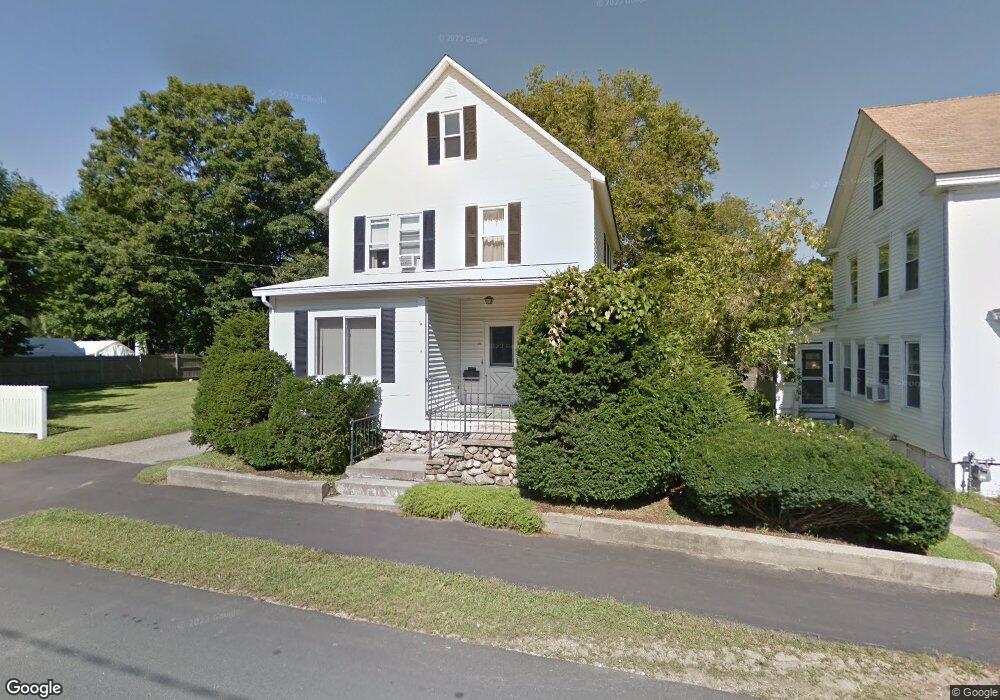
About This Home
This home is located at 20 Dolloff St, Laconia, NH 03246 and is currently estimated at $363,092, approximately $232 per square foot. 20 Dolloff St is a home located in Belknap County with nearby schools including Laconia Middle School, Laconia High School, and Holy Trinity Catholic School.
Ownership History
Date
Name
Owned For
Owner Type
Purchase Details
Closed on
Oct 28, 2005
Sold by
Lakeshore Plaza Llc
Bought by
Linteau Cheryl L
Current Estimated Value
Home Financials for this Owner
Home Financials are based on the most recent Mortgage that was taken out on this home.
Original Mortgage
$166,400
Outstanding Balance
$36,992
Interest Rate
5.79%
Estimated Equity
$326,101
Create a Home Valuation Report for This Property
The Home Valuation Report is an in-depth analysis detailing your home's value as well as a comparison with similar homes in the area
Home Values in the Area
Average Home Value in this Area
Purchase History
| Date | Buyer | Sale Price | Title Company |
|---|---|---|---|
| Linteau Cheryl L | $208,000 | -- |
Source: Public Records
Mortgage History
| Date | Status | Borrower | Loan Amount |
|---|---|---|---|
| Open | Linteau Cheryl L | $166,400 |
Source: Public Records
Tax History Compared to Growth
Tax History
| Year | Tax Paid | Tax Assessment Tax Assessment Total Assessment is a certain percentage of the fair market value that is determined by local assessors to be the total taxable value of land and additions on the property. | Land | Improvement |
|---|---|---|---|---|
| 2024 | $4,137 | $303,500 | $122,100 | $181,400 |
| 2023 | $3,988 | $286,700 | $111,800 | $174,900 |
| 2022 | $3,641 | $245,200 | $94,900 | $150,300 |
| 2021 | $3,742 | $198,400 | $62,900 | $135,500 |
| 2020 | $3,727 | $189,000 | $53,500 | $135,500 |
| 2019 | $3,791 | $184,100 | $48,900 | $135,200 |
| 2018 | $3,757 | $180,200 | $47,500 | $132,700 |
| 2017 | $3,253 | $154,700 | $46,600 | $108,100 |
| 2016 | $3,434 | $154,700 | $46,600 | $108,100 |
| 2015 | $3,488 | $157,100 | $49,000 | $108,100 |
| 2014 | $3,459 | $154,400 | $48,800 | $105,600 |
| 2013 | $3,352 | $151,800 | $46,200 | $105,600 |
Source: Public Records
Map
Nearby Homes
- 45 Joliet St
- 40 Bowman St
- 123 Merrimac St
- 42 Beaman St
- 87 Academy St
- 33 Avery St
- 45 Lafayette St
- 18-20 Cleveland Place
- 17 Rowell St
- 37 Vantagepoint Dr Unit 3
- 65 Broadview Dr Unit 1
- 44 Highland St
- 13 Lindsay Ct
- 284 Pine St
- 84 Spring St
- 17 Arch St
- 98 Water St
- 33 S Main St
- Lot 1 Winter St
- 7 Riverside Ct