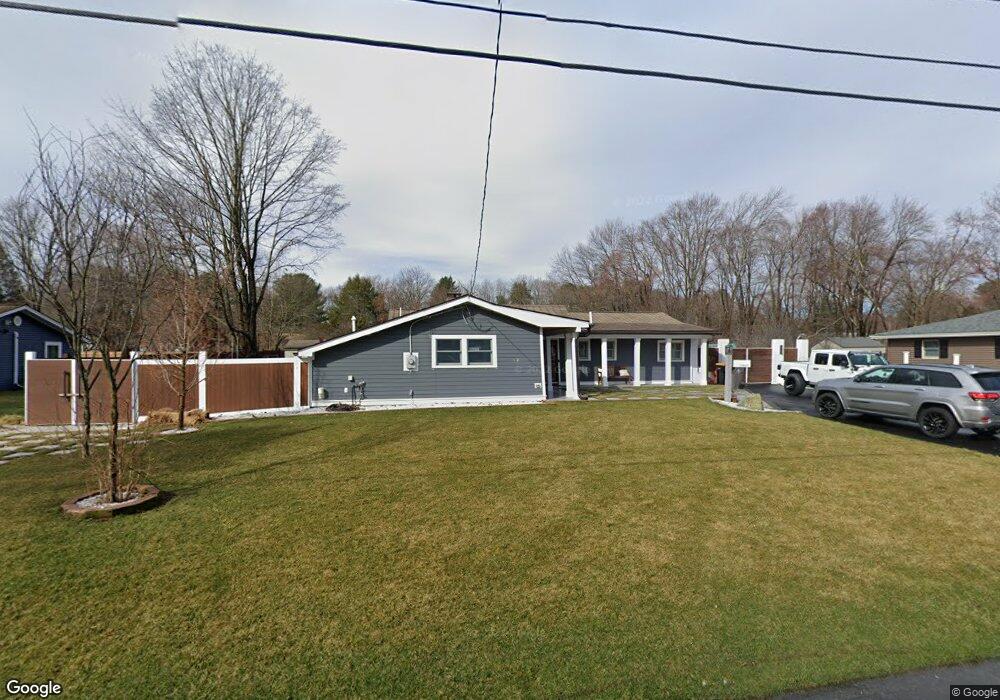
20 Doris Rd Framingham, MA 01701
Saxonville NeighborhoodEstimated Value: $647,000 - $681,000
3
Beds
2
Baths
1,415
Sq Ft
$473/Sq Ft
Est. Value
About This Home
This home is located at 20 Doris Rd, Framingham, MA 01701 and is currently estimated at $668,660, approximately $472 per square foot. 20 Doris Rd is a home located in Middlesex County with nearby schools including Framingham High School, Saint Bridget School, and Sudbury Valley School.
Ownership History
Date
Name
Owned For
Owner Type
Purchase Details
Closed on
Mar 24, 2014
Sold by
Crete Ann M
Bought by
Labrecque Jeffrey
Current Estimated Value
Home Financials for this Owner
Home Financials are based on the most recent Mortgage that was taken out on this home.
Original Mortgage
$242,929
Outstanding Balance
$183,500
Interest Rate
4.25%
Mortgage Type
FHA
Estimated Equity
$485,160
Purchase Details
Closed on
Nov 1, 1996
Sold by
Ferraro John L and Ferraro Mary C
Bought by
Crete Ann M
Create a Home Valuation Report for This Property
The Home Valuation Report is an in-depth analysis detailing your home's value as well as a comparison with similar homes in the area
Home Values in the Area
Average Home Value in this Area
Purchase History
| Date | Buyer | Sale Price | Title Company |
|---|---|---|---|
| Labrecque Jeffrey | $251,740 | -- | |
| Labrecque Jeffrey | $251,740 | -- | |
| Crete Ann M | $140,000 | -- | |
| Crete Ann M | $140,000 | -- |
Source: Public Records
Mortgage History
| Date | Status | Borrower | Loan Amount |
|---|---|---|---|
| Open | Labrecque Jeffrey | $242,929 | |
| Closed | Crete Ann M | $242,929 |
Source: Public Records
Tax History
| Year | Tax Paid | Tax Assessment Tax Assessment Total Assessment is a certain percentage of the fair market value that is determined by local assessors to be the total taxable value of land and additions on the property. | Land | Improvement |
|---|---|---|---|---|
| 2025 | $6,881 | $576,300 | $271,100 | $305,200 |
| 2024 | $6,561 | $526,600 | $242,200 | $284,400 |
| 2023 | $5,977 | $456,600 | $216,100 | $240,500 |
| 2022 | $5,477 | $398,600 | $196,100 | $202,500 |
| 2021 | $5,329 | $379,300 | $188,500 | $190,800 |
| 2020 | $5,336 | $356,200 | $171,300 | $184,900 |
| 2019 | $5,238 | $340,600 | $171,300 | $169,300 |
| 2018 | $4,914 | $301,100 | $164,900 | $136,200 |
| 2017 | $4,826 | $288,800 | $160,100 | $128,700 |
| 2016 | $4,755 | $273,600 | $160,100 | $113,500 |
| 2015 | $4,706 | $264,100 | $160,700 | $103,400 |
Source: Public Records
Map
Nearby Homes
Your Personal Tour Guide
Ask me questions while you tour the home.