20 Duncan Ct Springboro, OH 45066
Estimated Value: $251,000 - $304,000
4
Beds
2
Baths
1,764
Sq Ft
$154/Sq Ft
Est. Value
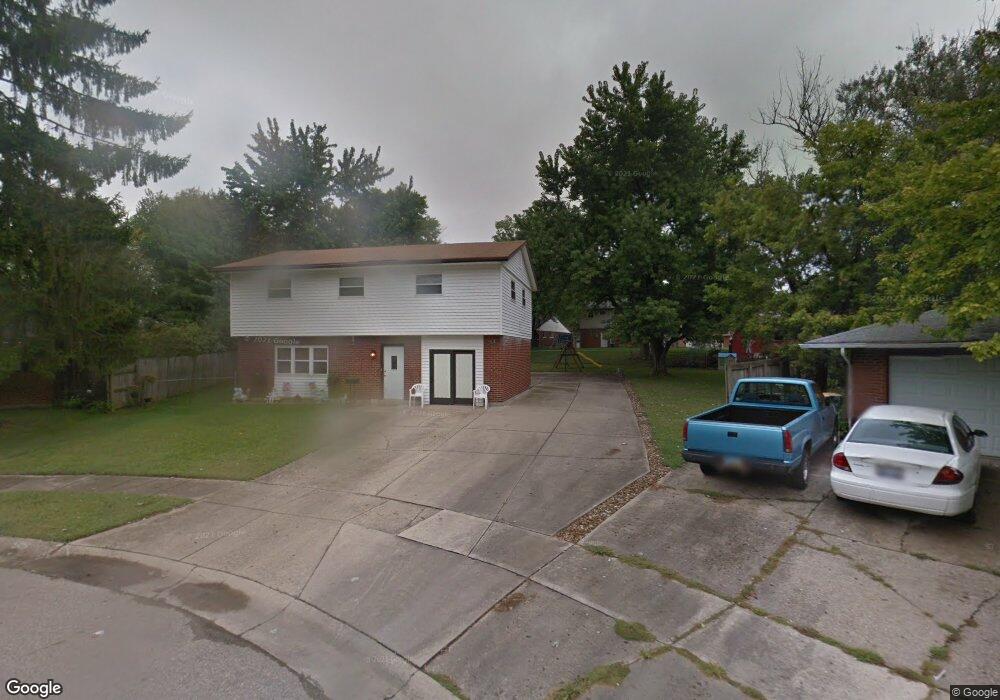
About This Home
This home is located at 20 Duncan Ct, Springboro, OH 45066 and is currently estimated at $271,212, approximately $153 per square foot. 20 Duncan Ct is a home located in Warren County with nearby schools including Clearcreek Elementary School, Springboro Intermediate School, and Dennis Elementary School.
Ownership History
Date
Name
Owned For
Owner Type
Purchase Details
Closed on
Oct 19, 2021
Sold by
Beall Nicole M and Beall Nicolle
Bought by
Faithful Holdings Llc
Current Estimated Value
Purchase Details
Closed on
Dec 9, 2019
Sold by
Parks Stephen J and Parks Teri L
Bought by
Beall Nicole M
Home Financials for this Owner
Home Financials are based on the most recent Mortgage that was taken out on this home.
Original Mortgage
$12,500
Interest Rate
3.7%
Mortgage Type
New Conventional
Purchase Details
Closed on
Nov 30, 2010
Sold by
Murphy Linda K and Murphy Linda
Bought by
Parks Stephen J and Parks Teri L
Home Financials for this Owner
Home Financials are based on the most recent Mortgage that was taken out on this home.
Original Mortgage
$126,299
Interest Rate
4.75%
Mortgage Type
FHA
Create a Home Valuation Report for This Property
The Home Valuation Report is an in-depth analysis detailing your home's value as well as a comparison with similar homes in the area
Home Values in the Area
Average Home Value in this Area
Purchase History
| Date | Buyer | Sale Price | Title Company |
|---|---|---|---|
| Faithful Holdings Llc | -- | None Available | |
| Beall Nicole M | $150,000 | Landmark Title Agency Inc | |
| Parks Stephen J | $128,000 | Partners Land Title Agency |
Source: Public Records
Mortgage History
| Date | Status | Borrower | Loan Amount |
|---|---|---|---|
| Previous Owner | Beall Nicole M | $12,500 | |
| Previous Owner | Parks Stephen J | $126,299 |
Source: Public Records
Tax History
| Year | Tax Paid | Tax Assessment Tax Assessment Total Assessment is a certain percentage of the fair market value that is determined by local assessors to be the total taxable value of land and additions on the property. | Land | Improvement |
|---|---|---|---|---|
| 2025 | $2,437 | $60,850 | $17,500 | $43,350 |
| 2024 | $2,437 | $60,850 | $17,500 | $43,350 |
| 2023 | $2,151 | $49,283 | $10,762 | $38,521 |
| 2022 | $2,119 | $49,284 | $10,763 | $38,521 |
| 2021 | $2,032 | $49,284 | $10,763 | $38,521 |
| 2020 | $1,898 | $40,068 | $8,750 | $31,318 |
| 2019 | $1,758 | $40,068 | $8,750 | $31,318 |
| 2018 | $1,651 | $40,068 | $8,750 | $31,318 |
| 2017 | $1,789 | $36,747 | $8,134 | $28,613 |
| 2016 | $1,753 | $36,747 | $8,134 | $28,613 |
| 2015 | $1,801 | $36,747 | $8,134 | $28,613 |
| 2014 | $1,801 | $35,680 | $7,900 | $27,780 |
| 2013 | $1,800 | $39,530 | $8,750 | $30,780 |
Source: Public Records
Map
Nearby Homes
- 10 Woods Rd
- 35 Edgebrooke Dr
- 490 W Market St
- 84 W Mill St
- 330 East St
- 65 Ed Knoll Bend
- 40 Libby Hollow St
- 80 Elkins Ln
- 90 Libby Hollow St
- 225 Renwood Place
- 60 Rosewood Dr
- 140 Dan Haven Place
- 45 Wadestone St
- 70 Eleanor Dr
- 15 Wadestone Ln
- 50 Morris St
- 45 Morris St Unit 15
- 8 Glasgow St Unit 30
- 65 Morris St Unit 17
- 45 Morris St
Your Personal Tour Guide
Ask me questions while you tour the home.