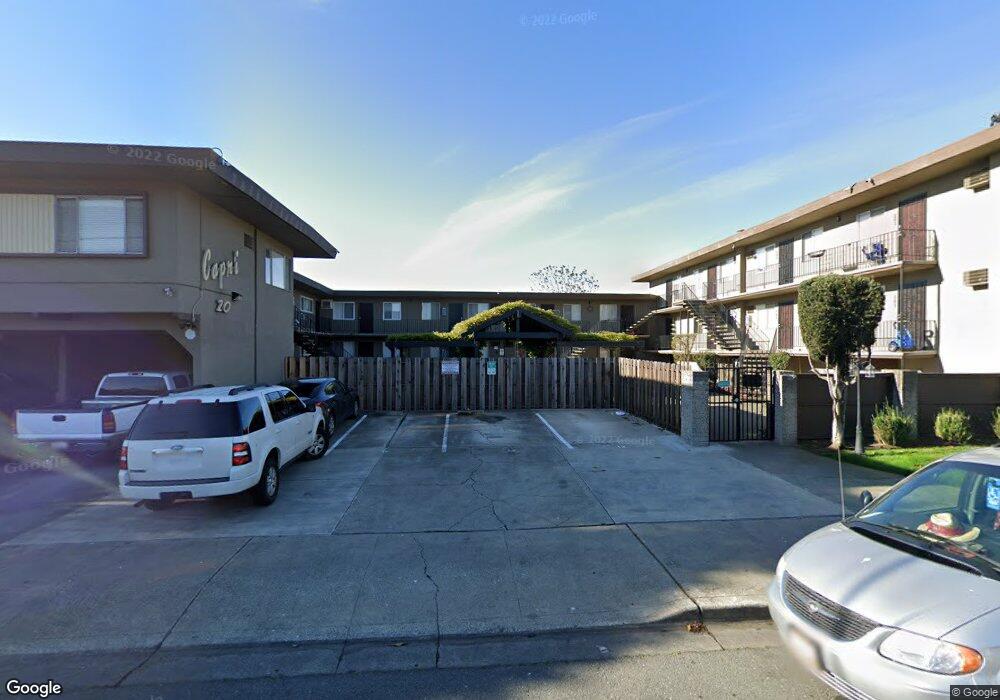
20 E 16th St Antioch, CA 94509
North Antioch Neighborhood
1
Bed
--
Bath
650
Sq Ft
21,344
Sq Ft Lot
About This Home
Please review our rental requirements then contact us to schedule a tour.
RENTAL REQUIREMENTS:
- Income = 3xRent
- Credit = 640+
- No current delinquencies with previous landlords or Utility Companies.
- No prior evictions
As of January 1, 2025, all incoming residents must carry Renter’s Insurance with min liability of $100k
Total move-in cost = first month’s rent + SD (security deposit)
*Resident pays utilities.
*Application fee = $40
*ASK ABOUT OUR PET POLICY*
Thank you, we look forward to meeting you.
Create a Home Valuation Report for This Property
The Home Valuation Report is an in-depth analysis detailing your home's value as well as a comparison with similar homes in the area
Home Values in the Area
Average Home Value in this Area
Property History
| Date | Event | Price | List to Sale | Price per Sq Ft |
|---|---|---|---|---|
| 05/20/2025 05/20/25 | Off Market | $1,550 | -- | -- |
| 03/22/2025 03/22/25 | Price Changed | $1,550 | +11.1% | $2 / Sq Ft |
| 03/21/2025 03/21/25 | Price Changed | $1,395 | 0.0% | $2 / Sq Ft |
| 03/21/2025 03/21/25 | For Rent | $1,395 | -12.5% | -- |
| 11/04/2024 11/04/24 | Off Market | $1,595 | -- | -- |
| 09/25/2024 09/25/24 | For Rent | $1,595 | 0.0% | -- |
| 05/14/2024 05/14/24 | For Rent | $1,595 | -- | -- |
Tax History
| Year | Tax Paid | Tax Assessment Tax Assessment Total Assessment is a certain percentage of the fair market value that is determined by local assessors to be the total taxable value of land and additions on the property. | Land | Improvement |
|---|---|---|---|---|
| 2025 | $34,369 | $2,048,060 | $263,554 | $1,784,506 |
| 2024 | $32,070 | $2,008,590 | $258,387 | $1,750,203 |
| 2023 | $32,070 | $1,970,170 | $253,321 | $1,716,849 |
| 2022 | $31,678 | $1,930,442 | $248,354 | $1,682,088 |
| 2021 | $30,425 | $1,892,846 | $243,485 | $1,649,361 |
| 2019 | $29,562 | $1,838,946 | $236,264 | $1,602,682 |
| 2018 | $28,505 | $1,804,244 | $231,632 | $1,572,612 |
| 2017 | $27,571 | $1,764,233 | $227,091 | $1,537,142 |
| 2016 | $26,838 | $1,731,404 | $222,639 | $1,508,765 |
| 2015 | $26,363 | $1,706,900 | $219,295 | $1,487,605 |
| 2014 | $25,474 | $1,675,040 | $215,000 | $1,460,040 |
Source: Public Records
Map
Nearby Homes
Your Personal Tour Guide
Ask me questions while you tour the home.