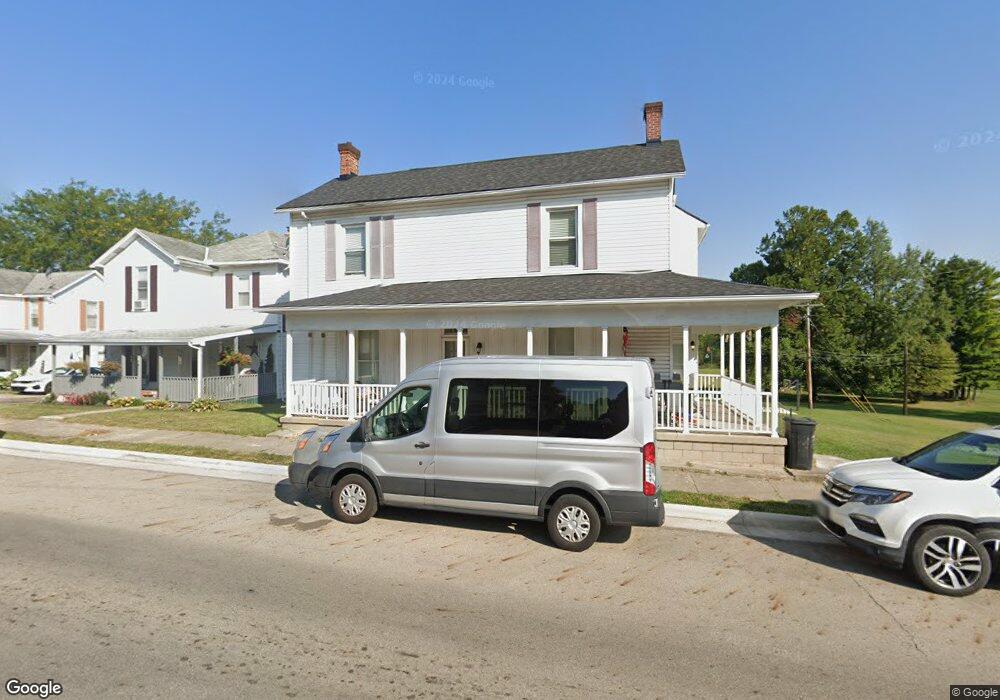
20 E Columbus Rd South Charleston, OH 45368
Estimated Value: $118,000 - $266,000
--
Bed
--
Bath
--
Sq Ft
0.32
Acres
About This Home
This home is located at 20 E Columbus Rd, South Charleston, OH 45368 and is currently estimated at $201,333. 20 E Columbus Rd is a home located in Clark County with nearby schools including Miami View Elementary School and Southeastern Senior High School.
Ownership History
Date
Name
Owned For
Owner Type
Purchase Details
Closed on
Jan 30, 2017
Sold by
Johnson Dirk and Johnson Kenna
Bought by
Murray John M
Current Estimated Value
Home Financials for this Owner
Home Financials are based on the most recent Mortgage that was taken out on this home.
Original Mortgage
$125,300
Outstanding Balance
$103,627
Interest Rate
4.16%
Mortgage Type
New Conventional
Estimated Equity
$97,706
Purchase Details
Closed on
May 13, 2016
Sold by
U S Bank Trust N A
Bought by
Johnson Dirk and Johnson Kenna
Purchase Details
Closed on
Oct 23, 2015
Sold by
Lewis Jeffrey S
Bought by
U S Bank Trust Na and Lsf8 Master Participation Trusts
Purchase Details
Closed on
May 13, 2005
Sold by
Timmons Bradley J and Timmons Diana L
Bought by
Lewis Jeffrey S
Home Financials for this Owner
Home Financials are based on the most recent Mortgage that was taken out on this home.
Original Mortgage
$98,800
Interest Rate
6.29%
Mortgage Type
Fannie Mae Freddie Mac
Create a Home Valuation Report for This Property
The Home Valuation Report is an in-depth analysis detailing your home's value as well as a comparison with similar homes in the area
Home Values in the Area
Average Home Value in this Area
Purchase History
| Date | Buyer | Sale Price | Title Company |
|---|---|---|---|
| Murray John M | $128,000 | Team Title And Closing Servi | |
| Johnson Dirk | $34,000 | Landmark Title Agency South | |
| U S Bank Trust Na | $33,400 | Thoroughbred Title Agency In | |
| Lewis Jeffrey S | $123,500 | -- |
Source: Public Records
Mortgage History
| Date | Status | Borrower | Loan Amount |
|---|---|---|---|
| Open | Murray John M | $125,300 | |
| Previous Owner | Lewis Jeffrey S | $98,800 |
Source: Public Records
Tax History Compared to Growth
Tax History
| Year | Tax Paid | Tax Assessment Tax Assessment Total Assessment is a certain percentage of the fair market value that is determined by local assessors to be the total taxable value of land and additions on the property. | Land | Improvement |
|---|---|---|---|---|
| 2024 | $139 | $3,240 | $3,240 | -- |
| 2023 | $139 | $3,240 | $3,240 | $0 |
| 2022 | $133 | $3,240 | $3,240 | $0 |
| 2021 | $113 | $2,470 | $2,470 | $0 |
| 2020 | $113 | $2,470 | $2,470 | $0 |
| 2019 | $112 | $2,470 | $2,470 | $0 |
| 2018 | $109 | $2,470 | $2,470 | $0 |
| 2017 | $109 | $2,471 | $2,471 | $0 |
| 2016 | $108 | $2,471 | $2,471 | $0 |
| 2015 | $111 | $2,471 | $2,471 | $0 |
| 2014 | $111 | $2,471 | $2,471 | $0 |
| 2013 | $111 | $2,471 | $2,471 | $0 |
Source: Public Records
Map
Nearby Homes
- 20 E Columbus Rd
- 16 E Columbus Rd
- 0 W Columbus Rd
- 00 W Columbus Rd
- 12 E Columbus Rd
- 8 E Columbus Rd
- 102 N Chillicothe St Unit 106
- 110 N Chillicothe St
- 106 E Columbus Rd
- 114 N Chillicothe St
- 19 E Columbus Rd
- 15 E Columbus Rd
- 3 E Columbus Rd
- 118 N Chillicothe St
- 110 E Columbus Rd
- 3 U S 42
- 122 N Chillicothe St
- 126 N Chillicothe St
- 4 W Columbus Rd
- 35 N Church St