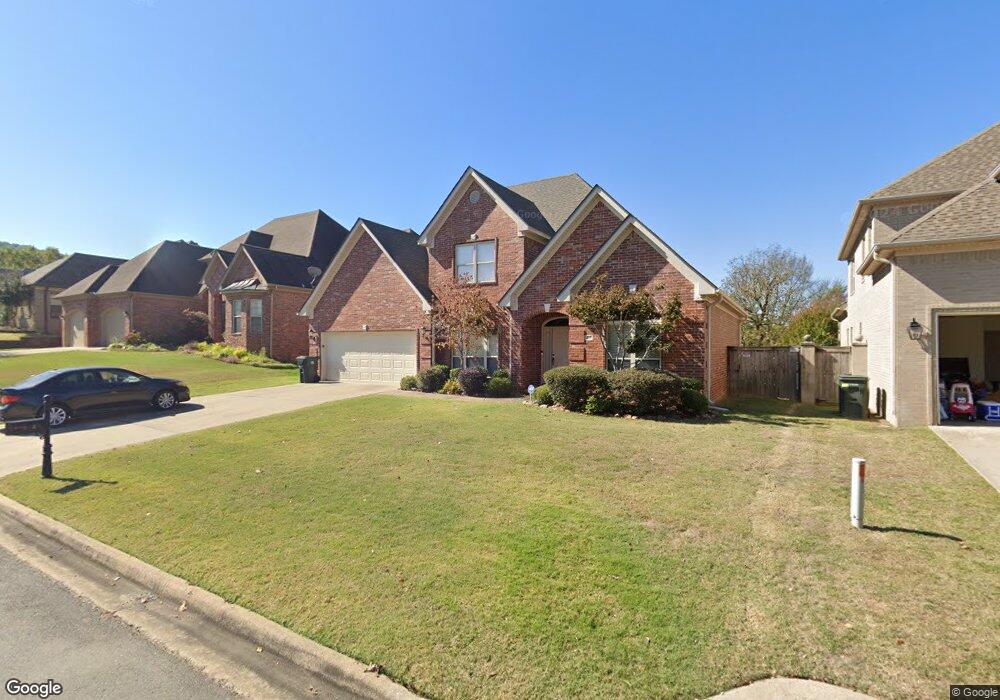
20 Epernay Cir Little Rock, AR 72223
Chenal Valley NeighborhoodEstimated Value: $498,416 - $531,000
--
Bed
3
Baths
3,331
Sq Ft
$153/Sq Ft
Est. Value
About This Home
This home is located at 20 Epernay Cir, Little Rock, AR 72223 and is currently estimated at $510,354, approximately $153 per square foot. 20 Epernay Cir is a home located in Pulaski County with nearby schools including Joe T. Robinson Elementary School, Joe T. Robinson Middle School, and Joe T. Robinson High School.
Ownership History
Date
Name
Owned For
Owner Type
Purchase Details
Closed on
Jan 28, 2009
Sold by
Damron James L and Damron Mary C
Bought by
Torrence Vivian Jannette
Current Estimated Value
Purchase Details
Closed on
Jan 22, 2007
Sold by
Holloway Glenn R and Holloway Barbara K
Bought by
Damron James L and Damron Mary C
Home Financials for this Owner
Home Financials are based on the most recent Mortgage that was taken out on this home.
Original Mortgage
$284,000
Interest Rate
6.1%
Mortgage Type
Purchase Money Mortgage
Purchase Details
Closed on
Jun 15, 2005
Sold by
Deltic Timber Corp
Bought by
Holloway Glenn R and Holloway Barbara K
Home Financials for this Owner
Home Financials are based on the most recent Mortgage that was taken out on this home.
Original Mortgage
$287,200
Interest Rate
5.58%
Mortgage Type
Purchase Money Mortgage
Create a Home Valuation Report for This Property
The Home Valuation Report is an in-depth analysis detailing your home's value as well as a comparison with similar homes in the area
Home Values in the Area
Average Home Value in this Area
Purchase History
| Date | Buyer | Sale Price | Title Company |
|---|---|---|---|
| Torrence Vivian Jannette | $334,000 | Bankers Title Llc | |
| Damron James L | $355,000 | First National Title Company | |
| Holloway Glenn R | $54,000 | Lenders Title Co |
Source: Public Records
Mortgage History
| Date | Status | Borrower | Loan Amount |
|---|---|---|---|
| Previous Owner | Damron James L | $284,000 | |
| Previous Owner | Holloway Glenn R | $287,200 |
Source: Public Records
Tax History Compared to Growth
Tax History
| Year | Tax Paid | Tax Assessment Tax Assessment Total Assessment is a certain percentage of the fair market value that is determined by local assessors to be the total taxable value of land and additions on the property. | Land | Improvement |
|---|---|---|---|---|
| 2025 | $3,674 | $85,268 | $11,600 | $73,668 |
| 2024 | $3,674 | $85,268 | $11,600 | $73,668 |
| 2023 | $3,674 | $85,268 | $11,600 | $73,668 |
| 2022 | $3,674 | $85,268 | $11,600 | $73,668 |
| 2021 | $3,703 | $57,140 | $11,000 | $46,140 |
| 2020 | $3,299 | $57,140 | $11,000 | $46,140 |
| 2019 | $3,299 | $57,140 | $11,000 | $46,140 |
| 2018 | $3,324 | $57,140 | $11,000 | $46,140 |
| 2017 | $3,324 | $57,140 | $11,000 | $46,140 |
| 2016 | $3,369 | $57,840 | $10,200 | $47,640 |
| 2015 | $3,748 | $57,840 | $10,200 | $47,640 |
| 2014 | $3,748 | $57,840 | $10,200 | $47,640 |
Source: Public Records
Map
Nearby Homes
- 21 Epernay Cir
- 308 Commentry Way
- 311 Commentry Way
- 37 Commentry Dr
- 49 Tournay Cir
- 638 Epernay Place
- 105 Chalamont Cove
- 109 Chalamont Cove
- 21 Rosans Ct
- 35 Rosans Ct
- 31 Corlay Dr
- 30 Caurel Ct
- 15 Chenay Dr
- 212 Caurel Ln
- 106 Chelle Ln
- 129 Challain Dr
- 94 Calion Ct
- 75 Calion Ct
- 133 Calion Ct
- 120 Calion Ct
- 16 Epernay Cir
- 14 Epernay Cir
- 26 Epernay Cir
- 46 Epernay Cir
- 44 Epernay Cir
- 40 Epernay Cir
- 32 Epernay Cir
- 17 Epernay Cir
- 38 Epernay Cir
- 12 Epernay Cir
- 50 Epernay Cir
- 15 Epernay Cir
- 23 Epernay Cir Unit Lot 10 Blk 72
- 0 Epernay Cir Unit 15016047
- 0 Epernay Cir Unit 15035834
- 0 Epernay Cir Unit 15035832
- 0 Epernay Cir Unit 16004254
- 0 Epernay Cir Unit 16008595
- 0 Epernay Cir Unit 10192663
- 0 Epernay Cir Unit 10192321