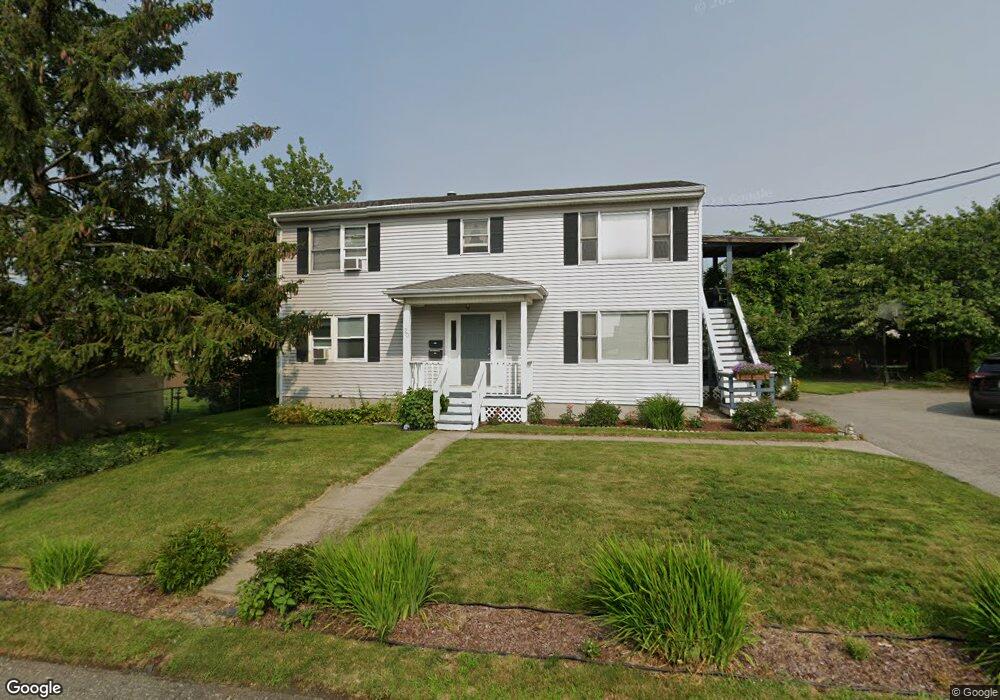
20 Fern St Fall River, MA 02724
Sandy Beach NeighborhoodEstimated Value: $453,000 - $490,000
4
Beds
2
Baths
2,080
Sq Ft
$230/Sq Ft
Est. Value
About This Home
This home is located at 20 Fern St, Fall River, MA 02724 and is currently estimated at $478,221, approximately $229 per square foot. 20 Fern St is a home located in Bristol County with nearby schools including Carlton M. Viveiros Elementary School, Matthew J. Kuss Middle School, and B M C Durfee High School.
Ownership History
Date
Name
Owned For
Owner Type
Purchase Details
Closed on
Sep 30, 1998
Sold by
Medeiros Thomas P
Bought by
Chabot Randy R
Current Estimated Value
Create a Home Valuation Report for This Property
The Home Valuation Report is an in-depth analysis detailing your home's value as well as a comparison with similar homes in the area
Home Values in the Area
Average Home Value in this Area
Purchase History
| Date | Buyer | Sale Price | Title Company |
|---|---|---|---|
| Chabot Randy R | $140,000 | -- |
Source: Public Records
Mortgage History
| Date | Status | Borrower | Loan Amount |
|---|---|---|---|
| Open | Chabot Randy R | $176,000 | |
| Closed | Chabot Randy R | $11,808 |
Source: Public Records
Tax History Compared to Growth
Tax History
| Year | Tax Paid | Tax Assessment Tax Assessment Total Assessment is a certain percentage of the fair market value that is determined by local assessors to be the total taxable value of land and additions on the property. | Land | Improvement |
|---|---|---|---|---|
| 2025 | $4,840 | $422,700 | $126,800 | $295,900 |
| 2024 | $4,429 | $385,500 | $122,000 | $263,500 |
| 2023 | $4,212 | $343,300 | $104,600 | $238,700 |
| 2022 | $3,849 | $305,000 | $95,100 | $209,900 |
| 2021 | $3,545 | $256,300 | $88,000 | $168,300 |
| 2020 | $3,157 | $218,500 | $84,200 | $134,300 |
| 2019 | $2,979 | $204,300 | $80,200 | $124,100 |
| 2018 | $2,787 | $190,600 | $78,700 | $111,900 |
| 2017 | $2,603 | $185,900 | $80,300 | $105,600 |
| 2016 | $2,542 | $186,500 | $83,600 | $102,900 |
| 2015 | $2,435 | $186,200 | $80,500 | $105,700 |
| 2014 | $2,519 | $200,200 | $84,800 | $115,400 |
Source: Public Records
Map
Nearby Homes
- 321 King St
- 160 Foote St
- 24 Hall St
- 636-644 Dwelly St
- 644-648 King Philip St
- 289 King Philip St
- 123 Hall St
- 20 Wilcox St
- 25 Winward St
- 27 Vista Way
- 15 Higgins St
- 909 Dwelly St
- 1313 So Main St Unit 2
- 616 Woodman St
- 1334 S Main St
- 11 Palmer St
- 31 Barker St
- 1273-1279 S Main St
- 36 Palmer St
- 126 Wheeler St