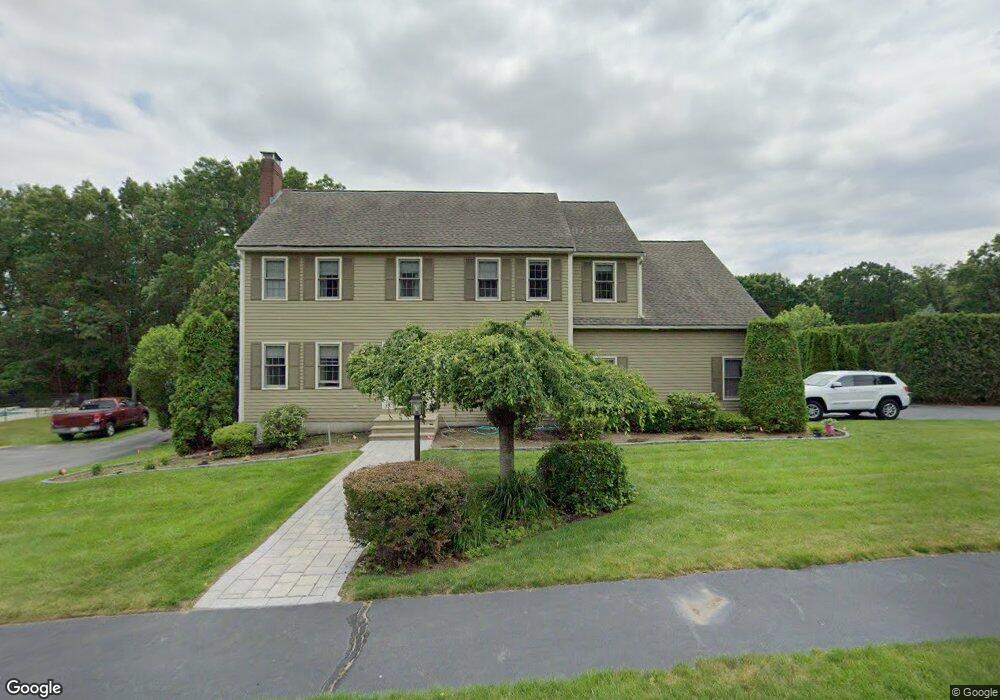
20 Flint Pond Rd Worcester, MA 01604
Broadmeadow Brook NeighborhoodEstimated Value: $680,278 - $816,000
3
Beds
1
Bath
1,288
Sq Ft
$583/Sq Ft
Est. Value
About This Home
This home is located at 20 Flint Pond Rd, Worcester, MA 01604 and is currently estimated at $751,320, approximately $583 per square foot. 20 Flint Pond Rd is a home located in Worcester County with nearby schools including Roosevelt Elementary School, Jacob Hiatt Magnet School, and Chandler Magnet.
Ownership History
Date
Name
Owned For
Owner Type
Purchase Details
Closed on
May 13, 2015
Sold by
Srw Rt and Wyse Shawn M
Bought by
Wyse Shawn M and Wyse Rosa M
Current Estimated Value
Purchase Details
Closed on
Aug 24, 2012
Sold by
Wyse Shawn M and Wyse Rosa M
Bought by
Srw Rt and Wyse Shawn M
Purchase Details
Closed on
Mar 29, 2007
Sold by
Ambrosino Rosa M and Wyse Rosa M
Bought by
Wyse Rosa M and Wyse Shawn M
Purchase Details
Closed on
Jun 27, 1996
Sold by
Etre Builders Inc
Bought by
Wyse Shawn M and Ambrosino Rosa
Purchase Details
Closed on
Jun 19, 1996
Sold by
Ap Etre Builders Inc
Bought by
Etre Builders Inc
Create a Home Valuation Report for This Property
The Home Valuation Report is an in-depth analysis detailing your home's value as well as a comparison with similar homes in the area
Home Values in the Area
Average Home Value in this Area
Purchase History
| Date | Buyer | Sale Price | Title Company |
|---|---|---|---|
| Wyse Shawn M | -- | -- | |
| Srw Rt | -- | -- | |
| Wyse Rosa M | -- | -- | |
| Wyse Shawn M | $171,200 | -- | |
| Etre Builders Inc | $50,000 | -- |
Source: Public Records
Mortgage History
| Date | Status | Borrower | Loan Amount |
|---|---|---|---|
| Previous Owner | Etre Builders Inc | $260,000 | |
| Previous Owner | Etre Builders Inc | $275,000 | |
| Previous Owner | Etre Builders Inc | $88,800 |
Source: Public Records
Tax History Compared to Growth
Tax History
| Year | Tax Paid | Tax Assessment Tax Assessment Total Assessment is a certain percentage of the fair market value that is determined by local assessors to be the total taxable value of land and additions on the property. | Land | Improvement |
|---|---|---|---|---|
| 2025 | $8,035 | $609,200 | $124,100 | $485,100 |
| 2024 | $7,975 | $580,000 | $124,100 | $455,900 |
| 2023 | $7,705 | $537,300 | $106,800 | $430,500 |
| 2022 | $7,191 | $472,800 | $85,400 | $387,400 |
| 2021 | $7,241 | $444,800 | $68,400 | $376,400 |
| 2020 | $6,979 | $410,500 | $68,100 | $342,400 |
| 2019 | $7,094 | $394,100 | $65,900 | $328,200 |
| 2018 | $7,012 | $370,800 | $65,900 | $304,900 |
| 2017 | $6,842 | $356,000 | $65,900 | $290,100 |
| 2016 | $7,106 | $344,800 | $55,400 | $289,400 |
| 2015 | $6,920 | $344,800 | $55,400 | $289,400 |
| 2014 | -- | $344,800 | $55,400 | $289,400 |
Source: Public Records
Map
Nearby Homes
- 38 Etre Dr
- 11 Maplewood Rd
- 27 A-B Grafton St
- 36 Westborough St
- 39 Pointe Rok Dr Unit 39
- 48 Pointe Rok Dr Unit 48G
- 589 Sunderland Rd
- 31 Crane St
- 1201 Grafton St Unit 73
- 7 Atlas St
- 15 Lakeside Dr
- 232 Weatherstone Dr
- 33 Lakeside Dr
- 12 Irene Ct
- 62 Edgemere Blvd
- 11 Westview Ave
- 23 Canna Dr
- 340 Sunderland Rd Unit 23
- 86 Wheelock Ave
- 2 Diane St
- 18 Flint Pond Rd
- 18 Flint Pond Rd Unit 9
- 14 Valente Dr
- 21 Valente Dr
- 21 Flint Pond Rd
- 21 Flint Pond Rd
- 21 Flint Pond Rd Unit 54
- 23 Valente Dr
- 19 Flint Pond Rd
- 19 Flint Pond Rd
- 19 Valente Dr
- 16 Flint Pond Rd
- 17 Valente Dr
- 25 Valente Dr
- 8 Valente Dr
- 15 Valente Dr
- 17 Flint Pond Rd
- 14 Flint Pond Rd
- 14 Flint Pond Rd Unit 7
- 13 Valente Dr