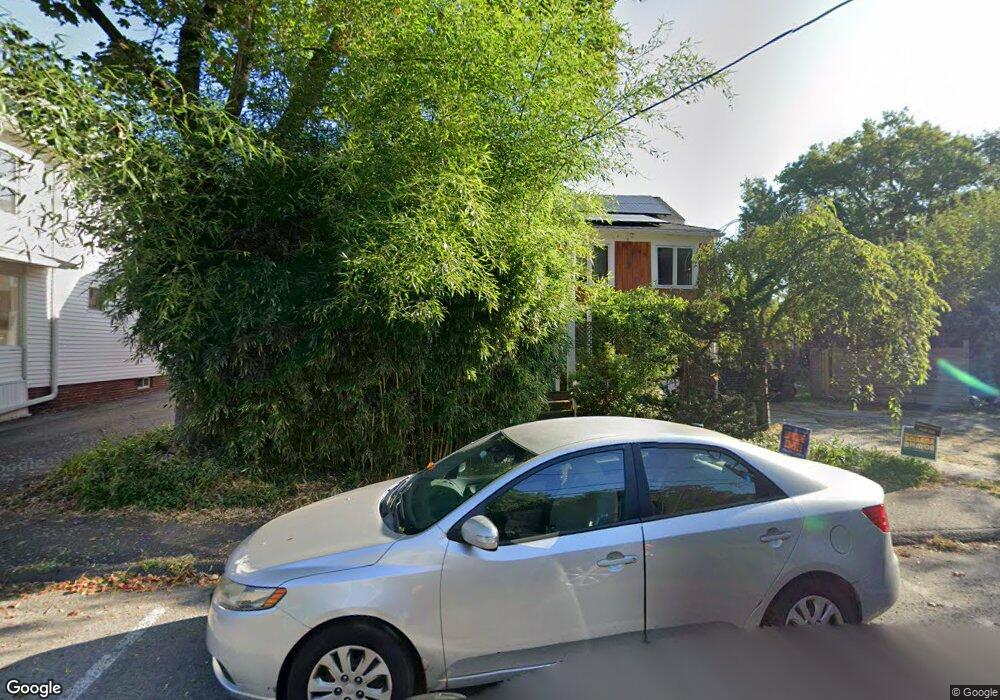
20 Fruit St Northampton, MA 01060
Estimated Value: $513,000 - $1,145,000
3
Beds
1
Bath
1,684
Sq Ft
$490/Sq Ft
Est. Value
About This Home
This home is located at 20 Fruit St, Northampton, MA 01060 and is currently estimated at $824,855, approximately $489 per square foot. 20 Fruit St is a home located in Hampshire County with nearby schools including Northampton High School, Hilltown Cooperative Charter Public School, and The Montessori School of Northampton.
Ownership History
Date
Name
Owned For
Owner Type
Purchase Details
Closed on
Jun 3, 2010
Sold by
Dan Jeffrey A
Bought by
Dan Jeffrey A and Elia Tala R
Current Estimated Value
Home Financials for this Owner
Home Financials are based on the most recent Mortgage that was taken out on this home.
Original Mortgage
$392,000
Outstanding Balance
$262,633
Interest Rate
5.12%
Mortgage Type
Purchase Money Mortgage
Estimated Equity
$562,222
Purchase Details
Closed on
Aug 7, 2003
Sold by
Nancy H Power Of Attor and Hopkins Vivian May
Bought by
Dan Jeffrey A
Home Financials for this Owner
Home Financials are based on the most recent Mortgage that was taken out on this home.
Original Mortgage
$183,200
Interest Rate
5.28%
Mortgage Type
Purchase Money Mortgage
Create a Home Valuation Report for This Property
The Home Valuation Report is an in-depth analysis detailing your home's value as well as a comparison with similar homes in the area
Home Values in the Area
Average Home Value in this Area
Purchase History
| Date | Buyer | Sale Price | Title Company |
|---|---|---|---|
| Dan Jeffrey A | -- | -- | |
| Dan Jeffrey A | $229,000 | -- |
Source: Public Records
Mortgage History
| Date | Status | Borrower | Loan Amount |
|---|---|---|---|
| Open | Dan Jeffrey A | $392,000 | |
| Previous Owner | Dan Jeffrey A | $183,200 |
Source: Public Records
Tax History Compared to Growth
Tax History
| Year | Tax Paid | Tax Assessment Tax Assessment Total Assessment is a certain percentage of the fair market value that is determined by local assessors to be the total taxable value of land and additions on the property. | Land | Improvement |
|---|---|---|---|---|
| 2025 | $12,640 | $907,400 | $148,500 | $758,900 |
| 2024 | $11,636 | $766,000 | $148,500 | $617,500 |
| 2023 | $10,499 | $662,800 | $135,000 | $527,800 |
| 2022 | $9,374 | $524,000 | $126,200 | $397,800 |
| 2021 | $5,188 | $520,200 | $120,200 | $400,000 |
| 2020 | $8,739 | $520,200 | $120,200 | $400,000 |
| 2019 | $8,537 | $491,500 | $110,200 | $381,300 |
| 2018 | $8,477 | $497,500 | $110,200 | $387,300 |
| 2017 | $8,303 | $497,500 | $110,200 | $387,300 |
| 2016 | $8,040 | $497,500 | $110,200 | $387,300 |
| 2015 | $7,944 | $502,800 | $115,200 | $387,600 |
| 2014 | $7,738 | $502,800 | $115,200 | $387,600 |
Source: Public Records
Map
Nearby Homes
- 67 Old South St
- 244 Main St
- 12 School St
- 35 New South St Unit 307
- 25 Munroe St
- 43 Center St Unit K
- 86 Lyman Rd
- 57 Columbus Ave
- 107 Williams St Unit 2c
- 107 Williams St Unit 3c
- 107 Williams St Unit A1
- 107 Williams St Unit 2B
- 56 Olive St
- 10 Hawley St Unit 4C
- 10 Hawley St Unit 4D
- 10 Hawley St Unit 4B
- 10 Hawley St Unit 4A
- 36 Butler Place
- 30 Graves Ave Unit B
- 58 Phillips Place