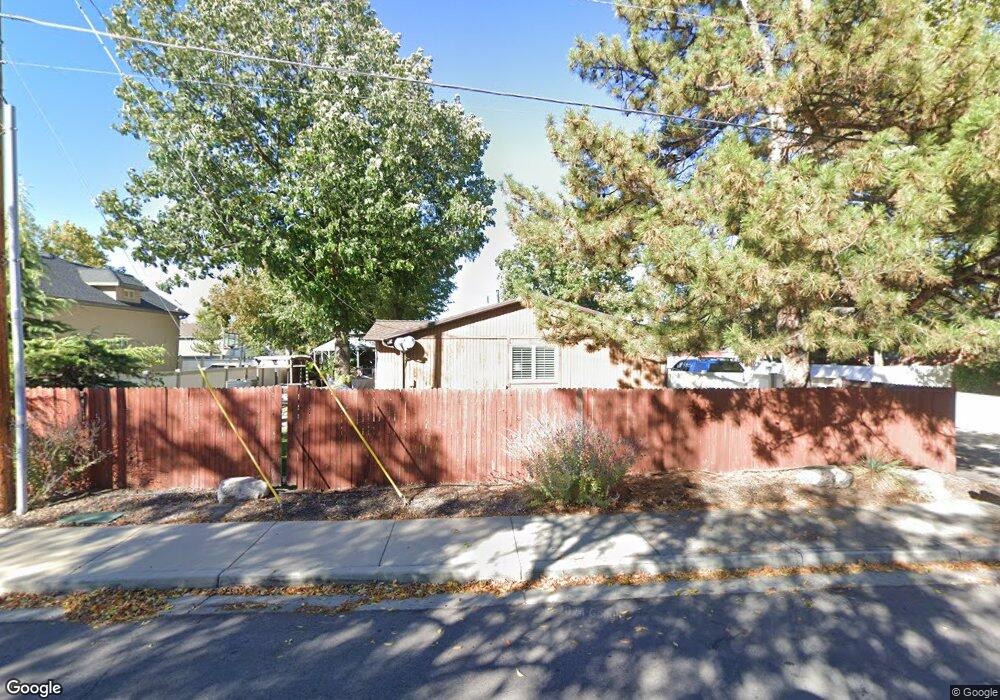
20 Glover Ln Midvale, UT 84047
Estimated Value: $829,000 - $997,000
7
Beds
5
Baths
3,672
Sq Ft
$254/Sq Ft
Est. Value
About This Home
This home is located at 20 Glover Ln, Midvale, UT 84047 and is currently estimated at $932,100, approximately $253 per square foot. 20 Glover Ln is a home located in Salt Lake County with nearby schools including East Midvale Elementary School, Hillcrest High School, and Midvale Middle School.
Ownership History
Date
Name
Owned For
Owner Type
Purchase Details
Closed on
Mar 11, 2011
Sold by
Glover Paul C and Glover Raylene M
Bought by
Glover Paul C and Glover Raylene M
Current Estimated Value
Purchase Details
Closed on
Dec 8, 2010
Sold by
Glover Paul C and Glover Raylene M
Bought by
Glover Paul C and Glover Raylene
Home Financials for this Owner
Home Financials are based on the most recent Mortgage that was taken out on this home.
Original Mortgage
$281,250
Interest Rate
4.18%
Mortgage Type
New Conventional
Create a Home Valuation Report for This Property
The Home Valuation Report is an in-depth analysis detailing your home's value as well as a comparison with similar homes in the area
Home Values in the Area
Average Home Value in this Area
Purchase History
| Date | Buyer | Sale Price | Title Company |
|---|---|---|---|
| Glover Paul C | -- | None Available | |
| Glover Paul C | -- | Advanced Title Slc |
Source: Public Records
Mortgage History
| Date | Status | Borrower | Loan Amount |
|---|---|---|---|
| Closed | Glover Paul C | $281,250 |
Source: Public Records
Tax History
| Year | Tax Paid | Tax Assessment Tax Assessment Total Assessment is a certain percentage of the fair market value that is determined by local assessors to be the total taxable value of land and additions on the property. | Land | Improvement |
|---|---|---|---|---|
| 2025 | $5,192 | $876,000 | $145,100 | $730,900 |
| 2024 | $5,192 | $852,500 | $137,600 | $714,900 |
| 2023 | $4,943 | $804,100 | $116,700 | $687,400 |
| 2022 | $5,057 | $803,700 | $114,400 | $689,300 |
| 2021 | $4,358 | $592,100 | $86,000 | $506,100 |
| 2020 | $4,153 | $534,000 | $86,000 | $448,000 |
| 2019 | $4,018 | $503,400 | $81,100 | $422,300 |
| 2018 | $3,562 | $451,300 | $81,100 | $370,200 |
| 2017 | $3,457 | $420,900 | $81,100 | $339,800 |
| 2016 | $3,459 | $408,500 | $81,100 | $327,400 |
| 2015 | $2,805 | $325,600 | $70,600 | $255,000 |
| 2014 | $2,708 | $307,000 | $68,100 | $238,900 |
Source: Public Records
Map
Nearby Homes
- 7045 S 65 E
- 6954 S 85 E
- 6849 S Jefferson St
- 7214 S 160 E Unit 1
- 7222 S 160 E Unit 3
- 195 E 7060 S
- 72 E 7320 S
- 106 E 7320 S
- 221 E Fort Union Blvd
- 6656 S Jefferson St Unit 15
- 24 W Lester Ave Unit C11
- 7097 S 230 E
- 30 W Lester Ave Unit D17
- 6556 S Jefferson St
- 228 Waterstone Cir Unit 10
- 7377 S Ramanee Dr
- 234 Waterstone Cir Unit 9
- 30 W 7500 S Unit 18
- 7033 S 300 E
- 7045 S 300 E
Your Personal Tour Guide
Ask me questions while you tour the home.