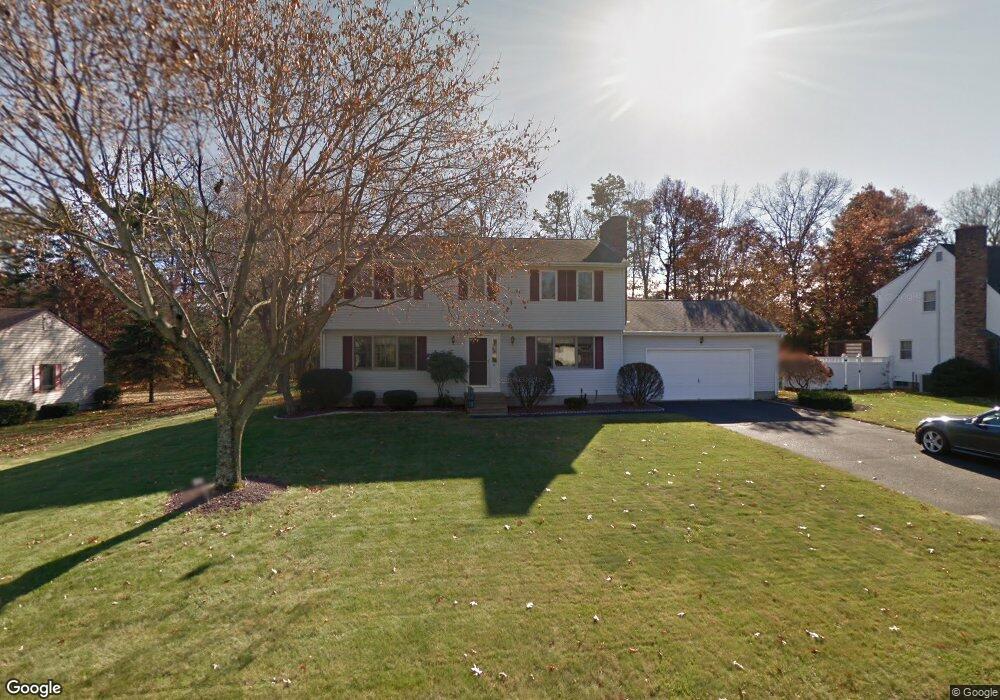
20 Golden Dr Easthampton, MA 01027
Estimated Value: $524,000 - $572,000
4
Beds
3
Baths
2,040
Sq Ft
$269/Sq Ft
Est. Value
About This Home
This home is located at 20 Golden Dr, Easthampton, MA 01027 and is currently estimated at $547,804, approximately $268 per square foot. 20 Golden Dr is a home located in Hampshire County with nearby schools including Easthampton High School, Calvary Baptist Christian School, and Tri-County Schools.
Ownership History
Date
Name
Owned For
Owner Type
Purchase Details
Closed on
Jun 24, 2022
Sold by
Donah James E and Donah Ann M
Bought by
Cadigan Abigail M and Cadigan Patrick J
Current Estimated Value
Home Financials for this Owner
Home Financials are based on the most recent Mortgage that was taken out on this home.
Original Mortgage
$275,000
Outstanding Balance
$260,988
Interest Rate
5.3%
Mortgage Type
Purchase Money Mortgage
Estimated Equity
$286,816
Purchase Details
Closed on
Mar 15, 1991
Sold by
Braley Walter C and Braley Jean
Bought by
Donah James E and Donah Ann M
Create a Home Valuation Report for This Property
The Home Valuation Report is an in-depth analysis detailing your home's value as well as a comparison with similar homes in the area
Home Values in the Area
Average Home Value in this Area
Purchase History
| Date | Buyer | Sale Price | Title Company |
|---|---|---|---|
| Cadigan Abigail M | $425,000 | None Available | |
| Donah James E | $155,000 | -- |
Source: Public Records
Mortgage History
| Date | Status | Borrower | Loan Amount |
|---|---|---|---|
| Open | Cadigan Abigail M | $275,000 | |
| Previous Owner | Donah James E | $200,000 | |
| Previous Owner | Donah James E | $60,000 | |
| Previous Owner | Donah James E | $221,250 |
Source: Public Records
Tax History
| Year | Tax Paid | Tax Assessment Tax Assessment Total Assessment is a certain percentage of the fair market value that is determined by local assessors to be the total taxable value of land and additions on the property. | Land | Improvement |
|---|---|---|---|---|
| 2025 | $6,027 | $440,900 | $131,600 | $309,300 |
| 2024 | $5,810 | $428,500 | $127,800 | $300,700 |
| 2023 | $4,849 | $331,000 | $100,500 | $230,500 |
| 2022 | $5,471 | $331,000 | $100,500 | $230,500 |
| 2021 | $6,225 | $343,500 | $100,500 | $243,000 |
| 2020 | $5,879 | $331,000 | $100,500 | $230,500 |
| 2019 | $5,300 | $342,800 | $117,200 | $225,600 |
| 2018 | $5,096 | $318,500 | $110,400 | $208,100 |
| 2017 | $4,973 | $306,800 | $106,200 | $200,600 |
| 2016 | $4,783 | $306,800 | $106,200 | $200,600 |
| 2015 | $4,648 | $306,800 | $106,200 | $200,600 |
Source: Public Records
Map
Nearby Homes
- 29 Sandra Rd
- 4 Laurel Dr
- 36 & 36R Holly Cir
- 36 Line St
- 1 Plain St
- 245 Park St
- 95 Gunn Rd
- 2 W Park Dr
- 6 S St & Abutting Lots
- 7 Western View Rd
- 41 South St Unit 11
- 48 Gunn Rd
- 38 College Hwy
- Lot 3 Mountain Rd
- 19 Mount Tom Ave Unit 19
- 385 Main St
- 36 County Rd
- 19 Nicols Way Unit 19
- M143 &152 Glendale St
- 2 Oak St
Your Personal Tour Guide
Ask me questions while you tour the home.