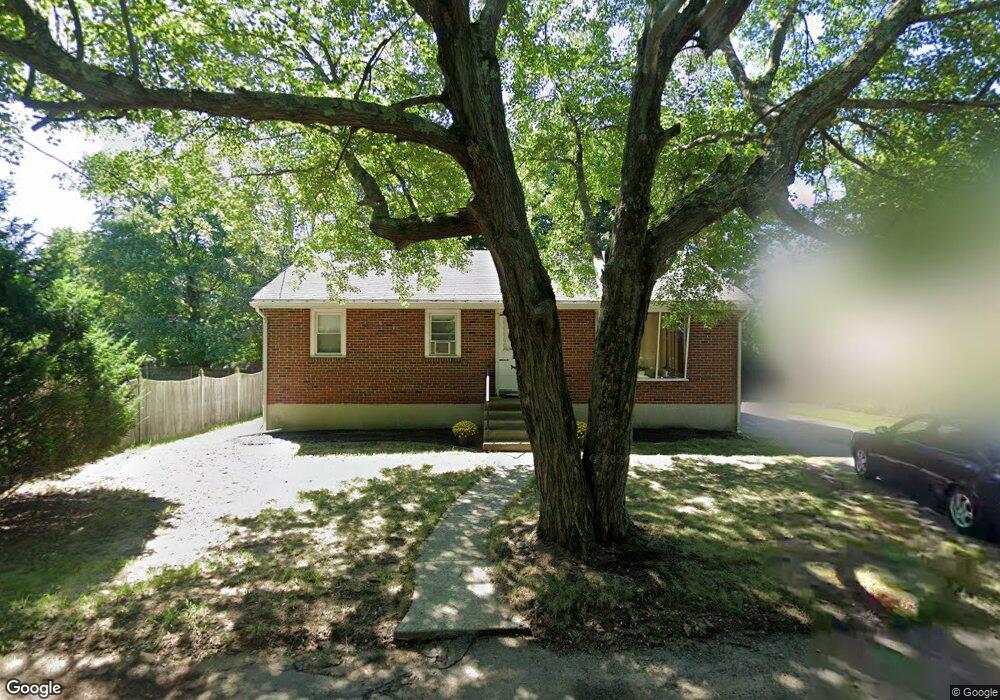
20 Green St Rockland, MA 02370
Estimated Value: $515,000 - $532,000
--
Bed
1
Bath
1,092
Sq Ft
$481/Sq Ft
Est. Value
About This Home
This home is located at 20 Green St, Rockland, MA 02370 and is currently estimated at $524,729, approximately $480 per square foot. 20 Green St is a home located in Plymouth County with nearby schools including Rockland Senior High School, Calvary Chapel Academy, and Holy Family Elementary School.
Ownership History
Date
Name
Owned For
Owner Type
Purchase Details
Closed on
Oct 20, 2006
Sold by
Curry Yvette
Bought by
Roland Mark A and Woodward Katherine M
Current Estimated Value
Home Financials for this Owner
Home Financials are based on the most recent Mortgage that was taken out on this home.
Original Mortgage
$290,000
Outstanding Balance
$173,335
Interest Rate
6.49%
Mortgage Type
Purchase Money Mortgage
Estimated Equity
$351,394
Create a Home Valuation Report for This Property
The Home Valuation Report is an in-depth analysis detailing your home's value as well as a comparison with similar homes in the area
Home Values in the Area
Average Home Value in this Area
Purchase History
| Date | Buyer | Sale Price | Title Company |
|---|---|---|---|
| Roland Mark A | $290,000 | -- |
Source: Public Records
Mortgage History
| Date | Status | Borrower | Loan Amount |
|---|---|---|---|
| Open | Roland Mark A | $290,000 |
Source: Public Records
Tax History Compared to Growth
Tax History
| Year | Tax Paid | Tax Assessment Tax Assessment Total Assessment is a certain percentage of the fair market value that is determined by local assessors to be the total taxable value of land and additions on the property. | Land | Improvement |
|---|---|---|---|---|
| 2025 | $6,303 | $461,100 | $223,700 | $237,400 |
| 2024 | $6,116 | $435,000 | $211,000 | $224,000 |
| 2023 | $6,077 | $399,300 | $193,500 | $205,800 |
| 2022 | $5,863 | $350,000 | $168,300 | $181,700 |
| 2021 | $116 | $312,500 | $153,000 | $159,500 |
| 2020 | $5,210 | $297,700 | $145,700 | $152,000 |
| 2019 | $106 | $284,000 | $138,800 | $145,200 |
| 2018 | $4,728 | $259,500 | $138,800 | $120,700 |
| 2017 | $4,600 | $248,900 | $138,800 | $110,100 |
| 2016 | $4,430 | $239,600 | $133,500 | $106,100 |
| 2015 | $4,234 | $222,500 | $124,700 | $97,800 |
| 2014 | $4,004 | $218,300 | $122,300 | $96,000 |
Source: Public Records
Map
Nearby Homes
- 46 Wardson Cir
- 20 Birch St
- 28 Nevens Cir
- 11 Chestnut Cir
- 40 Fir Rd Unit 386
- 6 Chestnut Cir
- 27 Fir Rd
- 1 Canterbury Ln
- 122 Reed St
- 100 North Ave
- 135 Grove St Unit 110
- 119 Grove St Unit 238
- 119 Grove St Unit 223
- 103 Grove St Unit 337
- 57 Battery St
- 3 Hickory Cir
- 29 West St
- 9 Juniper Cir
- 5 Juniper Cir
- 11 Hawthorne St