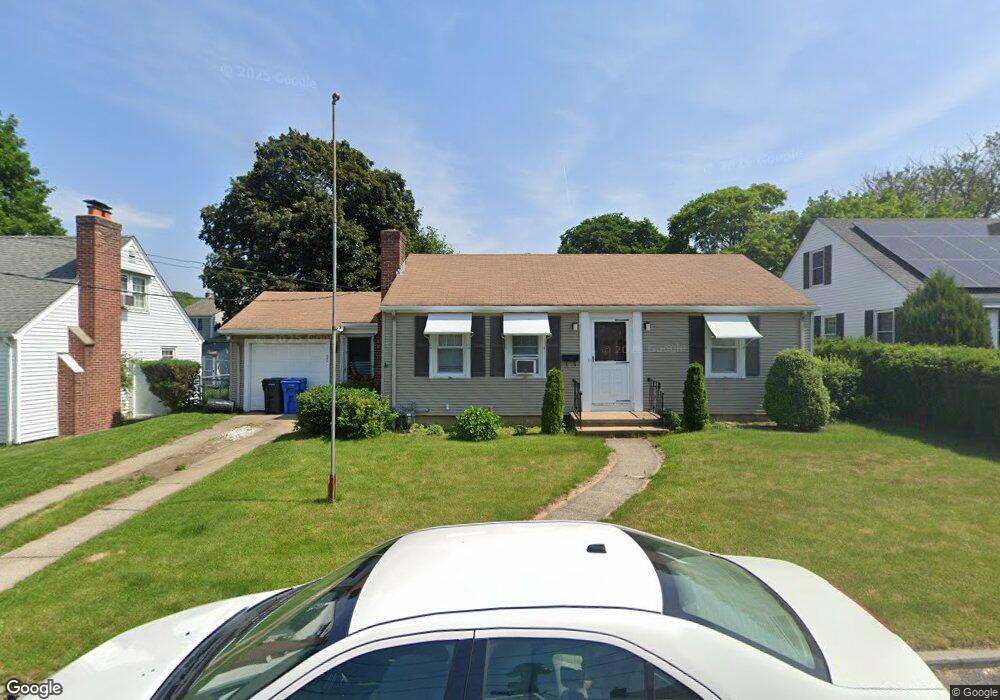
20 Hamilton Rd Cranston, RI 02910
Eden Park NeighborhoodEstimated Value: $318,000 - $449,000
2
Beds
1
Bath
816
Sq Ft
$459/Sq Ft
Est. Value
About This Home
This home is located at 20 Hamilton Rd, Cranston, RI 02910 and is currently estimated at $374,817, approximately $459 per square foot. 20 Hamilton Rd is a home located in Providence County with nearby schools including Park View Middle School, Cranston High School East, and Nel/Cps Construction Career.
Ownership History
Date
Name
Owned For
Owner Type
Purchase Details
Closed on
Aug 3, 2009
Sold by
Pettee Jean E
Bought by
Stork David R
Current Estimated Value
Home Financials for this Owner
Home Financials are based on the most recent Mortgage that was taken out on this home.
Original Mortgage
$75,000
Interest Rate
5.43%
Mortgage Type
Purchase Money Mortgage
Create a Home Valuation Report for This Property
The Home Valuation Report is an in-depth analysis detailing your home's value as well as a comparison with similar homes in the area
Home Values in the Area
Average Home Value in this Area
Purchase History
| Date | Buyer | Sale Price | Title Company |
|---|---|---|---|
| Stork David R | $163,500 | -- |
Source: Public Records
Mortgage History
| Date | Status | Borrower | Loan Amount |
|---|---|---|---|
| Open | Stork David R | $70,500 | |
| Closed | Stork David R | $82,000 | |
| Closed | Stork David R | $75,000 |
Source: Public Records
Tax History
| Year | Tax Paid | Tax Assessment Tax Assessment Total Assessment is a certain percentage of the fair market value that is determined by local assessors to be the total taxable value of land and additions on the property. | Land | Improvement |
|---|---|---|---|---|
| 2025 | $3,939 | $283,800 | $108,500 | $175,300 |
| 2024 | $3,863 | $283,800 | $108,500 | $175,300 |
| 2023 | $3,789 | $200,500 | $71,500 | $129,000 |
| 2022 | $3,711 | $200,500 | $71,500 | $129,000 |
| 2021 | $3,609 | $200,500 | $71,500 | $129,000 |
| 2020 | $3,452 | $166,200 | $68,100 | $98,100 |
| 2019 | $3,452 | $166,200 | $68,100 | $98,100 |
| 2018 | $3,372 | $166,200 | $68,100 | $98,100 |
| 2017 | $3,315 | $144,500 | $61,200 | $83,300 |
| 2016 | $3,244 | $144,500 | $61,200 | $83,300 |
| 2015 | $3,244 | $144,500 | $61,200 | $83,300 |
| 2014 | $3,303 | $144,600 | $61,200 | $83,400 |
Source: Public Records
Map
Nearby Homes
Your Personal Tour Guide
Ask me questions while you tour the home.