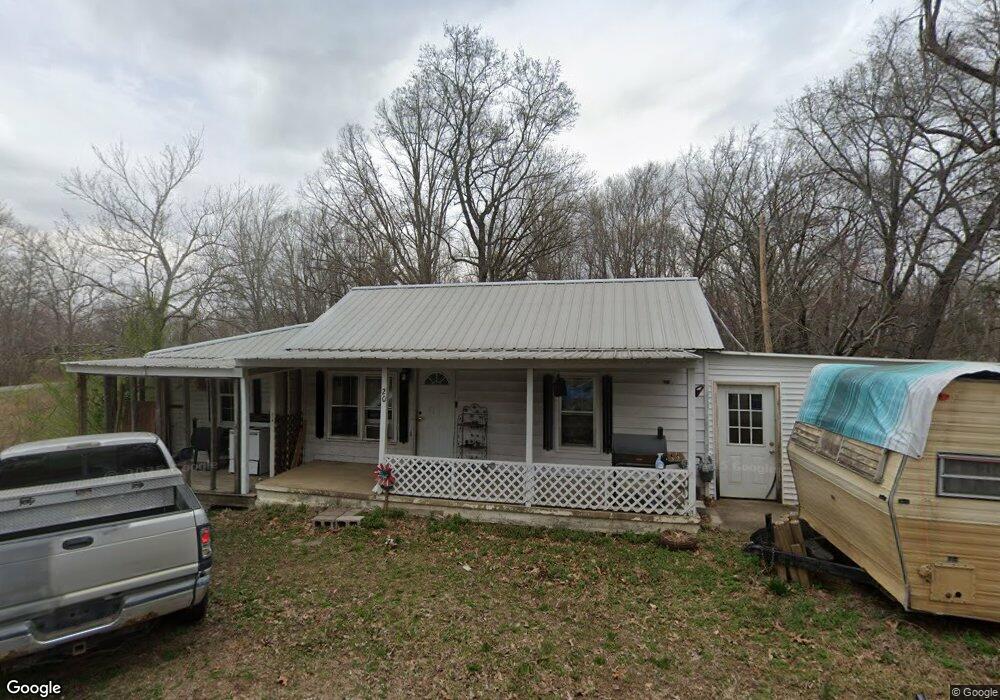
20 Hargis Rd Camden, TN 38320
Estimated Value: $44,000 - $130,000
--
Bed
1
Bath
1,131
Sq Ft
$64/Sq Ft
Est. Value
About This Home
This home is located at 20 Hargis Rd, Camden, TN 38320 and is currently estimated at $71,977, approximately $63 per square foot. 20 Hargis Rd is a home located in Benton County with nearby schools including Camden Elementary School, Briarwood School, and Camden Junior High School.
Ownership History
Date
Name
Owned For
Owner Type
Purchase Details
Closed on
Sep 24, 2021
Sold by
Magliozzi Elizabeth
Bought by
Garrett Jessie W and Morse Nettie
Current Estimated Value
Home Financials for this Owner
Home Financials are based on the most recent Mortgage that was taken out on this home.
Original Mortgage
$34,086
Outstanding Balance
$30,948
Interest Rate
2.8%
Mortgage Type
FHA
Estimated Equity
$41,029
Purchase Details
Closed on
Jan 28, 2014
Sold by
Stevenson Harold E
Bought by
Magliozzi Elizabeth
Purchase Details
Closed on
May 14, 1997
Sold by
Bursey Velva Mae Etvir
Bought by
Stevenson Darlene Bursey
Purchase Details
Closed on
Apr 10, 1997
Bought by
Stevenson Darlene Bursey Etvir Harold E
Purchase Details
Closed on
Feb 25, 1986
Bought by
Bursey Velva Mae Etvir Garland
Purchase Details
Closed on
Feb 20, 1979
Create a Home Valuation Report for This Property
The Home Valuation Report is an in-depth analysis detailing your home's value as well as a comparison with similar homes in the area
Home Values in the Area
Average Home Value in this Area
Purchase History
| Date | Buyer | Sale Price | Title Company |
|---|---|---|---|
| Garrett Jessie W | $35,000 | None Available | |
| Magliozzi Elizabeth | $20,000 | -- | |
| Stevenson Darlene Bursey | -- | -- | |
| Stevenson Darlene Bursey Etvir Harold E | -- | -- | |
| Bursey Velva Mae Etvir Garland | -- | -- | |
| -- | -- | -- |
Source: Public Records
Mortgage History
| Date | Status | Borrower | Loan Amount |
|---|---|---|---|
| Open | Garrett Jessie W | $34,086 |
Source: Public Records
Tax History Compared to Growth
Tax History
| Year | Tax Paid | Tax Assessment Tax Assessment Total Assessment is a certain percentage of the fair market value that is determined by local assessors to be the total taxable value of land and additions on the property. | Land | Improvement |
|---|---|---|---|---|
| 2025 | $437 | $19,300 | $0 | $0 |
| 2024 | $437 | $11,925 | $1,750 | $10,175 |
| 2023 | $437 | $11,925 | $1,750 | $10,175 |
| 2022 | $437 | $11,925 | $1,750 | $10,175 |
| 2021 | $437 | $11,925 | $1,750 | $10,175 |
| 2020 | $438 | $11,925 | $1,750 | $10,175 |
| 2019 | $340 | $8,625 | $1,750 | $6,875 |
| 2018 | $340 | $8,625 | $1,750 | $6,875 |
| 2017 | $340 | $8,625 | $1,750 | $6,875 |
| 2016 | $340 | $8,625 | $1,750 | $6,875 |
| 2015 | $344 | $8,625 | $1,750 | $6,875 |
| 2014 | $305 | $8,625 | $1,750 | $6,875 |
| 2013 | $305 | $7,734 | $0 | $0 |
Source: Public Records
Map
Nearby Homes
- 1905 Post Oak Rd
- 435 Bills Dr
- 0 Highway 641 N
- 1 Post Oak Rd
- 000 Laveta Ln
- 2250 Highway 69a
- 2905 Old Highway 69
- 0 Cedar Dr
- 000 Cedar Dr
- 130 Mimosa St
- 0 Higdon Ck Rd Unit RTC2993447
- 510 Longview St
- 166 Westview St
- 0 Longview St
- 180 Post Oak Ave
- 309 Asbury Rd
- 3295 Mount Carmel Rd
- 0 Asbury Rd
- 1762 Washington Ave
- 335 Mount Carmel Rd
- 1570 Oakdale Rd
- 1535 Oakdale Rd
- 1490 Oakdale Rd
- 1615 Oakdale Rd
- 150 Hargis Rd
- 1455 Oakdale Rd
- 125 Hargis Rd
- 1680 Oakdale Rd
- 1665 Oakdale Rd
- 0 Hargis Rd
- 165 Hargis Rd
- 1740 Oakdale Rd
- 1340 Oakdale Rd
- 1305 Oakdale Rd
- 1776 Oakdale Rd
- 1789 Oakdale Rd
- 1300 Oakdale Rd
- 313 Oakdale Rd
- 1280 Oakdale Rd
- 2410 McKelvy Rd