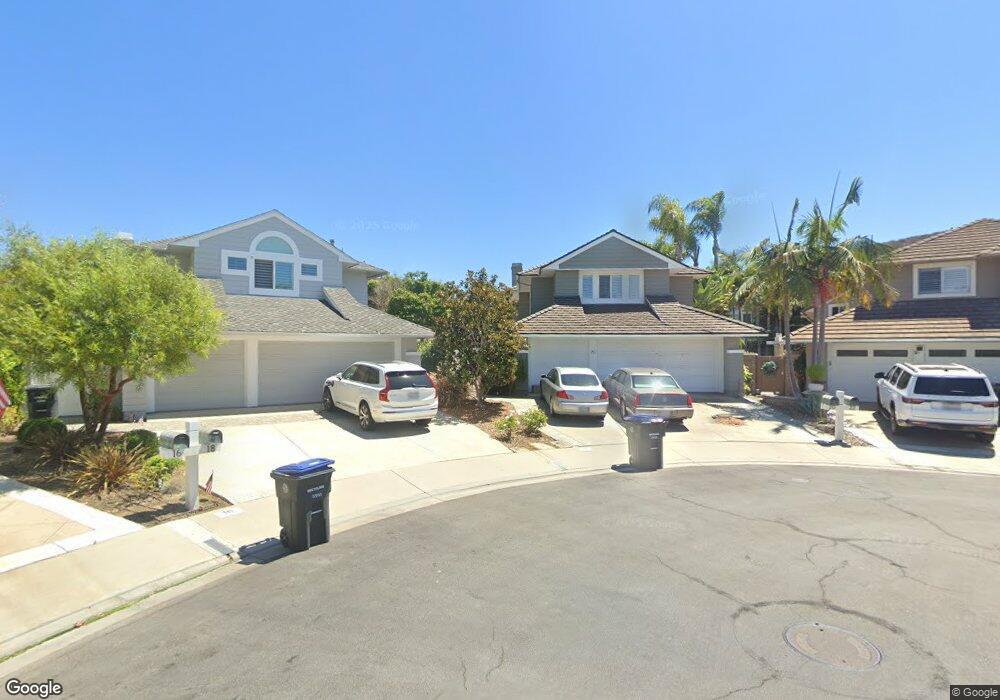
20 Henley Dr Laguna Niguel, CA 92677
Laguna Heights NeighborhoodEstimated Value: $1,808,029 - $2,076,000
4
Beds
3
Baths
2,585
Sq Ft
$748/Sq Ft
Est. Value
About This Home
This home is located at 20 Henley Dr, Laguna Niguel, CA 92677 and is currently estimated at $1,932,507, approximately $747 per square foot. 20 Henley Dr is a home located in Orange County with nearby schools including George White Elementary, Niguel Hills Middle School, and Dana Hills High School.
Ownership History
Date
Name
Owned For
Owner Type
Purchase Details
Closed on
Mar 12, 1998
Sold by
Bivona Robin M and Bivona Patricia A
Bought by
Levy Mark T and Levy Lynn T
Current Estimated Value
Home Financials for this Owner
Home Financials are based on the most recent Mortgage that was taken out on this home.
Original Mortgage
$313,600
Outstanding Balance
$57,623
Interest Rate
7.07%
Estimated Equity
$1,874,884
Purchase Details
Closed on
Jun 27, 1996
Sold by
Jon Kojaku and Jon Mie
Bought by
Bivona Robin M and Bivona Patricia A
Home Financials for this Owner
Home Financials are based on the most recent Mortgage that was taken out on this home.
Original Mortgage
$295,200
Interest Rate
8.23%
Purchase Details
Closed on
Jun 17, 1994
Sold by
Burns Larry L and Burns Mary A
Bought by
Kojaku Jon and Kojaku Mie Yoshikawa
Home Financials for this Owner
Home Financials are based on the most recent Mortgage that was taken out on this home.
Original Mortgage
$198,000
Interest Rate
8.65%
Create a Home Valuation Report for This Property
The Home Valuation Report is an in-depth analysis detailing your home's value as well as a comparison with similar homes in the area
Home Values in the Area
Average Home Value in this Area
Purchase History
| Date | Buyer | Sale Price | Title Company |
|---|---|---|---|
| Levy Mark T | $392,000 | Landwood Title Company | |
| Bivona Robin M | $328,000 | Chicago Title Insurance Co | |
| Kojaku Jon | $330,000 | Orange Coast Title |
Source: Public Records
Mortgage History
| Date | Status | Borrower | Loan Amount |
|---|---|---|---|
| Open | Levy Mark T | $313,600 | |
| Previous Owner | Bivona Robin M | $295,200 | |
| Previous Owner | Kojaku Jon | $198,000 |
Source: Public Records
Tax History Compared to Growth
Tax History
| Year | Tax Paid | Tax Assessment Tax Assessment Total Assessment is a certain percentage of the fair market value that is determined by local assessors to be the total taxable value of land and additions on the property. | Land | Improvement |
|---|---|---|---|---|
| 2025 | $6,369 | $647,274 | $298,959 | $348,315 |
| 2024 | $6,369 | $634,583 | $293,097 | $341,486 |
| 2023 | $6,232 | $622,141 | $287,350 | $334,791 |
| 2022 | $6,112 | $609,943 | $281,716 | $328,227 |
| 2021 | $5,993 | $597,984 | $276,192 | $321,792 |
| 2020 | $5,933 | $591,853 | $273,360 | $318,493 |
| 2019 | $5,815 | $580,249 | $268,000 | $312,249 |
| 2018 | $5,702 | $568,872 | $262,745 | $306,127 |
| 2017 | $5,589 | $557,718 | $257,593 | $300,125 |
| 2016 | $5,481 | $546,783 | $252,542 | $294,241 |
| 2015 | $5,397 | $538,570 | $248,748 | $289,822 |
| 2014 | $5,292 | $528,021 | $243,876 | $284,145 |
Source: Public Records
Map
Nearby Homes
- 31681 Peppertree Bend
- 2 O Hill Ridge
- 5 Pointe Sur Unit 123
- 6 Sand Pointe
- 25 Niguel Pointe # 84 Dr
- 90 Cameray Heights
- 56 Cameray Heights
- 6 Inspiration Point
- 31891 Paseo Alto Plano
- 18 Asilomar Rd
- 143 Cameray Heights Unit 37
- 1 Searidge
- 31872 Paseo Cielo
- 31527 Aguacate Rd
- 31 Russell Ln
- 2 Daytona Dr Unit 129
- 0 Aguacate Rd Unit 25558127
- 25852 Calle Ricardo
- 35 Emerald Glen
- 19 Old Ranch Rd
- 18 Henley Dr
- 22 Henley Dr
- 17 Oakcliff Dr
- 15 Oakcliff Dr
- 19 Oakcliff Dr
- 21 Salt Spray Dr
- 19 Salt Spray Dr
- 23 Salt Spray Dr
- 13 Oakcliff Dr
- 16 Henley Dr
- 17 Salt Spray Dr
- 25 Salt Spray Dr
- 24 Henley Dr
- 11 Oakcliff Dr
- 15 Salt Spray Dr
- 27 Salt Spray Dr
- 14 Henley Dr
- 11 Salt Spray Dr
- 26 Henley Dr
- 9 Oakcliff Dr