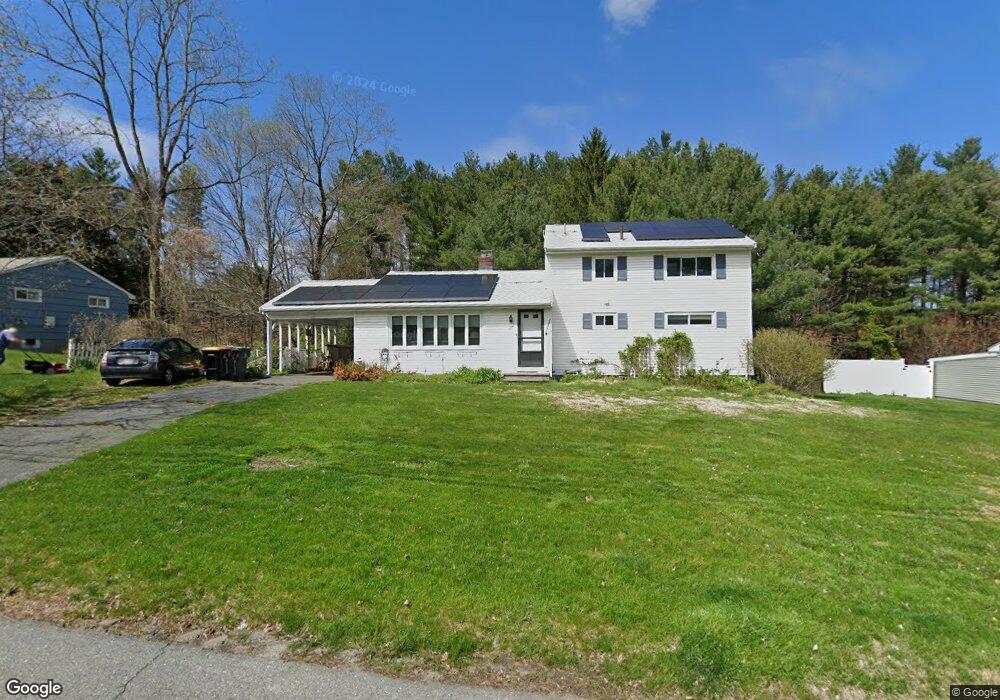
20 Hiram Rd Framingham, MA 01701
Nobscot NeighborhoodEstimated Value: $687,000 - $724,000
4
Beds
2
Baths
1,852
Sq Ft
$378/Sq Ft
Est. Value
About This Home
This home is located at 20 Hiram Rd, Framingham, MA 01701 and is currently estimated at $699,771, approximately $377 per square foot. 20 Hiram Rd is a home located in Middlesex County with nearby schools including Framingham High School, MetroWest Jewish Day School, and Sudbury Valley School.
Ownership History
Date
Name
Owned For
Owner Type
Purchase Details
Closed on
Mar 10, 2016
Sold by
Sandler Mark N and Sandler Diane E
Bought by
Sandler Ft and Sandler
Current Estimated Value
Purchase Details
Closed on
Apr 26, 2007
Sold by
Sandler Diane E and Sandler Mark N
Bought by
Sandler Diane E and Sandler Jack
Create a Home Valuation Report for This Property
The Home Valuation Report is an in-depth analysis detailing your home's value as well as a comparison with similar homes in the area
Home Values in the Area
Average Home Value in this Area
Purchase History
| Date | Buyer | Sale Price | Title Company |
|---|---|---|---|
| Sandler Ft | -- | -- | |
| Sandler Ft | -- | -- | |
| Sandler Diane E | $134,750 | -- | |
| Sandler Diane E | $134,750 | -- |
Source: Public Records
Mortgage History
| Date | Status | Borrower | Loan Amount |
|---|---|---|---|
| Previous Owner | Sandler Diane E | $105,000 |
Source: Public Records
Tax History Compared to Growth
Tax History
| Year | Tax Paid | Tax Assessment Tax Assessment Total Assessment is a certain percentage of the fair market value that is determined by local assessors to be the total taxable value of land and additions on the property. | Land | Improvement |
|---|---|---|---|---|
| 2025 | $7,381 | $618,200 | $272,400 | $345,800 |
| 2024 | $7,151 | $573,900 | $243,300 | $330,600 |
| 2023 | $6,749 | $515,600 | $217,200 | $298,400 |
| 2022 | $6,439 | $468,600 | $197,000 | $271,600 |
| 2021 | $6,262 | $445,700 | $189,400 | $256,300 |
| 2020 | $6,378 | $425,800 | $172,100 | $253,700 |
| 2019 | $6,397 | $415,900 | $172,100 | $243,800 |
| 2018 | $6,234 | $382,000 | $165,700 | $216,300 |
| 2017 | $6,121 | $366,300 | $160,900 | $205,400 |
| 2016 | $5,967 | $343,300 | $160,900 | $182,400 |
| 2015 | $6,212 | $348,600 | $161,200 | $187,400 |
Source: Public Records
Map
Nearby Homes
- 106 Baldwin Ave
- 41 James St
- 19 Nob Hill Dr
- 91 Eaton Rd W
- 78 Apple d or Rd
- 32 Eaton Rd W
- 14 Eisenhower Rd
- 40 Gregory Rd
- 50 Juniper Ln
- 27 Sloane Dr
- 30 Nobscot Rd Unit 14
- 53 Davidson Rd
- 128 Nobscot Rd
- 18 Lomas Dr
- 270 Edmands Rd
- 769 Edgell Rd
- 463 Edmands Rd
- 84 Hopestill Brown Rd
- 82 Joseph Rd
- 6 Mountain View Dr