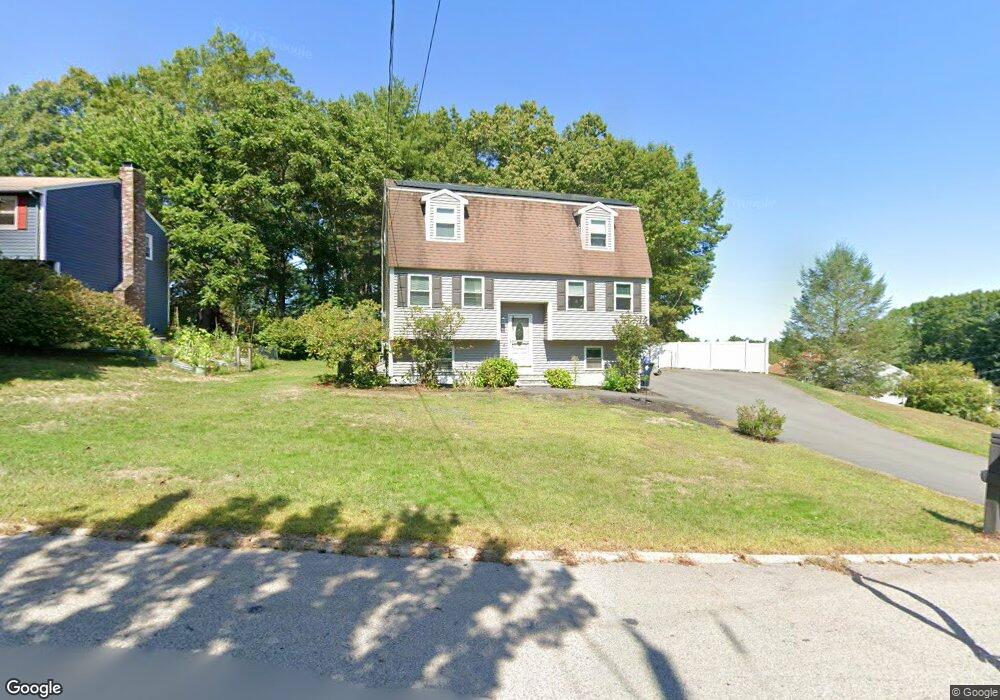
20 Holbrook Dr Nashua, NH 03062
Southwest Nashua NeighborhoodEstimated Value: $555,000 - $620,000
3
Beds
2
Baths
1,744
Sq Ft
$331/Sq Ft
Est. Value
About This Home
This home is located at 20 Holbrook Dr, Nashua, NH 03062 and is currently estimated at $577,209, approximately $330 per square foot. 20 Holbrook Dr is a home located in Hillsborough County with nearby schools including New Searles School, Fairgrounds Middle School, and Nashua High School South.
Ownership History
Date
Name
Owned For
Owner Type
Purchase Details
Closed on
Mar 25, 2021
Sold by
Ciano Glen and Ciano Kellie
Bought by
Ciano Glen and Ciano Kellie
Current Estimated Value
Home Financials for this Owner
Home Financials are based on the most recent Mortgage that was taken out on this home.
Original Mortgage
$278,540
Outstanding Balance
$249,976
Interest Rate
2.9%
Mortgage Type
FHA
Estimated Equity
$327,233
Purchase Details
Closed on
Sep 11, 2001
Sold by
Simoneau Roger R and Simoneau Janie P
Bought by
Ciano Glen
Home Financials for this Owner
Home Financials are based on the most recent Mortgage that was taken out on this home.
Original Mortgage
$178,589
Interest Rate
7.05%
Mortgage Type
Purchase Money Mortgage
Create a Home Valuation Report for This Property
The Home Valuation Report is an in-depth analysis detailing your home's value as well as a comparison with similar homes in the area
Home Values in the Area
Average Home Value in this Area
Purchase History
| Date | Buyer | Sale Price | Title Company |
|---|---|---|---|
| Ciano Glen | -- | None Available | |
| Ciano Glen | $180,000 | -- |
Source: Public Records
Mortgage History
| Date | Status | Borrower | Loan Amount |
|---|---|---|---|
| Open | Ciano Glen | $278,540 | |
| Previous Owner | Ciano Glen | $281,155 | |
| Previous Owner | Ciano Glen | $66,786 | |
| Previous Owner | Ciano Glen | $280,000 | |
| Previous Owner | Ciano Glen | $178,589 |
Source: Public Records
Tax History Compared to Growth
Tax History
| Year | Tax Paid | Tax Assessment Tax Assessment Total Assessment is a certain percentage of the fair market value that is determined by local assessors to be the total taxable value of land and additions on the property. | Land | Improvement |
|---|---|---|---|---|
| 2024 | $7,915 | $497,800 | $164,000 | $333,800 |
| 2023 | $7,697 | $422,200 | $131,200 | $291,000 |
| 2022 | $7,629 | $422,200 | $131,200 | $291,000 |
| 2021 | $6,518 | $280,700 | $87,400 | $193,300 |
| 2020 | $6,347 | $280,700 | $87,400 | $193,300 |
| 2019 | $6,108 | $280,700 | $87,400 | $193,300 |
| 2018 | $5,954 | $280,700 | $87,400 | $193,300 |
| 2017 | $6,123 | $237,400 | $71,400 | $166,000 |
| 2016 | $5,952 | $237,400 | $71,400 | $166,000 |
| 2015 | $5,664 | $230,900 | $71,400 | $159,500 |
| 2014 | $5,553 | $230,900 | $71,400 | $159,500 |
Source: Public Records
Map
Nearby Homes
- 4 Henry David Dr Unit 203
- 23 Glen Dr
- 2 Wakefield Dr
- 5 Wilderness Dr
- 375 Main Dunstable Rd
- 29 Greenwood Dr
- 15 Westray Dr
- 25 Cortez Dr Unit U57
- 57 Wethersfield Rd
- 16 Laurel Ct Unit U320
- 30 Gendron St
- 47 Dogwood Dr Unit U202
- 31 Tenby Dr
- 247 Main Dunstable Rd
- 8 Althea Ln Unit U26
- 11 Bordeaux St
- 5 Appaloosa Place
- 40 Spring Cove Rd Unit U117
- 599 W Hollis St
- 12 Spring Cove Rd Unit U103