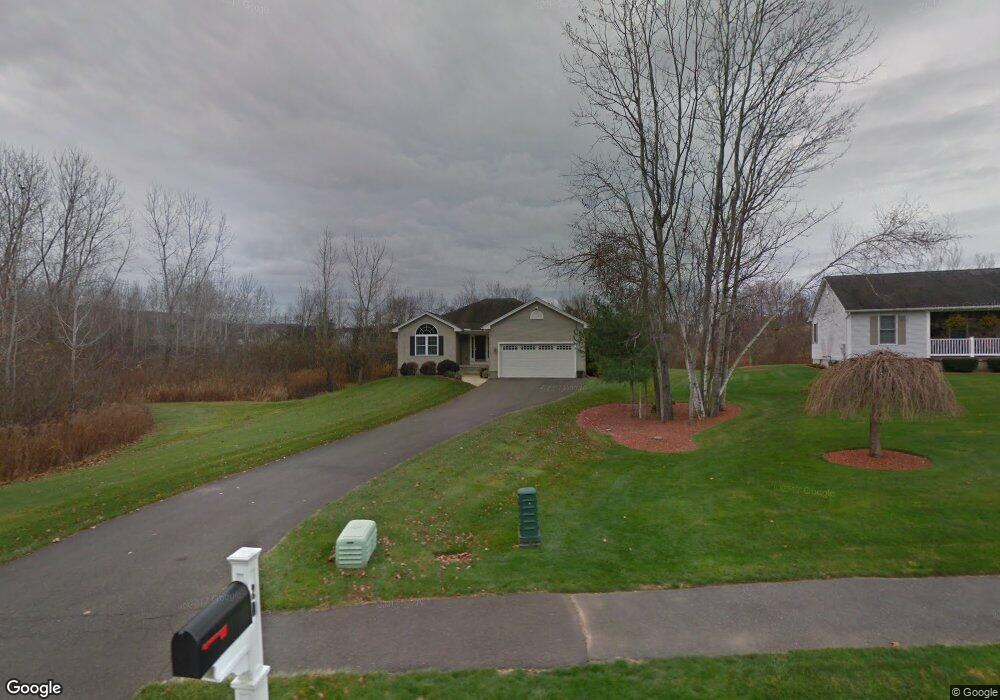
20 Holly Cir Easthampton, MA 01027
Estimated Value: $650,779 - $728,000
2
Beds
3
Baths
1,768
Sq Ft
$392/Sq Ft
Est. Value
About This Home
This home is located at 20 Holly Cir, Easthampton, MA 01027 and is currently estimated at $693,195, approximately $392 per square foot. 20 Holly Cir is a home located in Hampshire County with nearby schools including Easthampton High School, Hilltown Cooperative Charter Public School, and Calvary Baptist Christian School.
Ownership History
Date
Name
Owned For
Owner Type
Purchase Details
Closed on
Jun 9, 2025
Sold by
J J & Dawn M Jarmen Ret and Pine
Bought by
Pine Maureen and Lynn Karen E
Current Estimated Value
Home Financials for this Owner
Home Financials are based on the most recent Mortgage that was taken out on this home.
Original Mortgage
$185,000
Outstanding Balance
$184,525
Interest Rate
6.81%
Mortgage Type
Purchase Money Mortgage
Estimated Equity
$508,670
Purchase Details
Closed on
Dec 13, 2024
Sold by
Jarmen Joseph J and Jarmen Dawn M
Bought by
J J & Dawn M Jarmen Ret and Jarmen
Purchase Details
Closed on
Jul 16, 2001
Sold by
Emerson Sr=Pa Donald C and Marek Par Walter L
Bought by
Jarmen Dawn M and Jarmen Joseph J
Create a Home Valuation Report for This Property
The Home Valuation Report is an in-depth analysis detailing your home's value as well as a comparison with similar homes in the area
Home Values in the Area
Average Home Value in this Area
Purchase History
| Date | Buyer | Sale Price | Title Company |
|---|---|---|---|
| Pine Maureen | $700,000 | None Available | |
| Pine Maureen | $700,000 | None Available | |
| J J & Dawn M Jarmen Ret | -- | None Available | |
| J J & Dawn M Jarmen Ret | -- | None Available | |
| J J & Dawn M Jarmen Ret | -- | None Available | |
| Jarmen Dawn M | $46,000 | -- | |
| Jarmen Dawn M | $46,000 | -- |
Source: Public Records
Mortgage History
| Date | Status | Borrower | Loan Amount |
|---|---|---|---|
| Open | Pine Maureen | $185,000 | |
| Closed | Pine Maureen | $185,000 | |
| Previous Owner | Jarmen Dawn M | $25,000 | |
| Previous Owner | Jarmen Dawn M | $200,000 |
Source: Public Records
Tax History
| Year | Tax Paid | Tax Assessment Tax Assessment Total Assessment is a certain percentage of the fair market value that is determined by local assessors to be the total taxable value of land and additions on the property. | Land | Improvement |
|---|---|---|---|---|
| 2025 | $6,686 | $489,100 | $102,700 | $386,400 |
| 2024 | $6,644 | $490,000 | $99,500 | $390,500 |
| 2023 | $4,918 | $335,700 | $78,800 | $256,900 |
| 2022 | $5,549 | $335,700 | $78,800 | $256,900 |
| 2021 | $6,114 | $348,600 | $78,800 | $269,800 |
| 2020 | $5,962 | $335,700 | $78,800 | $256,900 |
| 2019 | $4,947 | $320,000 | $92,100 | $227,900 |
| 2018 | $4,725 | $295,300 | $86,800 | $208,500 |
| 2017 | $4,610 | $284,400 | $83,200 | $201,200 |
| 2016 | $4,607 | $295,500 | $83,200 | $212,300 |
| 2015 | $4,477 | $295,500 | $83,200 | $212,300 |
Source: Public Records
Map
Nearby Homes
- 36 & 36R Holly Cir
- 4 Laurel Dr
- 245 Park St
- 2 W Park Dr
- 6 S St & Abutting Lots
- 29 Sandra Rd
- 1 Plain St
- 95 Gunn Rd
- 36 Line St
- 41 South St Unit 11
- 385 Main St
- 19 Mount Tom Ave Unit 19
- 38 College Hwy
- 48 Gunn Rd
- M143 &152 Glendale St
- 19 Nicols Way Unit 19
- 2 Oak St
- 33 Knipfer Ave
- 7 Western View Rd
- 131 West St Unit 131
Your Personal Tour Guide
Ask me questions while you tour the home.