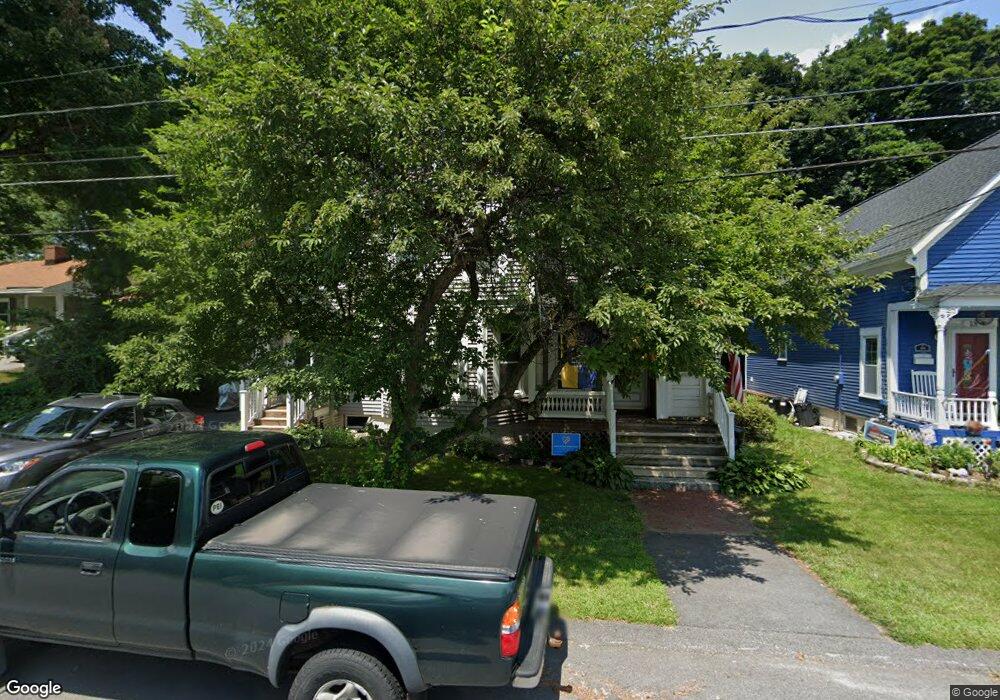
20 Holly St Concord, NH 03301
South End NeighborhoodEstimated Value: $436,803 - $478,000
4
Beds
2
Baths
1,980
Sq Ft
$234/Sq Ft
Est. Value
About This Home
This home is located at 20 Holly St, Concord, NH 03301 and is currently estimated at $462,451, approximately $233 per square foot. 20 Holly St is a home located in Merrimack County with nearby schools including Abbot-Downing School, Rundlett Middle School, and Concord High School.
Ownership History
Date
Name
Owned For
Owner Type
Purchase Details
Closed on
Feb 28, 2003
Sold by
Fraser David J
Bought by
Bardwell Thomas S and Bardwell Angelamaria Z
Current Estimated Value
Home Financials for this Owner
Home Financials are based on the most recent Mortgage that was taken out on this home.
Original Mortgage
$199,200
Outstanding Balance
$86,261
Interest Rate
5.98%
Mortgage Type
Purchase Money Mortgage
Estimated Equity
$376,190
Purchase Details
Closed on
Oct 17, 2001
Sold by
Schneck George and Schneck Grita H
Bought by
Fraser David J
Home Financials for this Owner
Home Financials are based on the most recent Mortgage that was taken out on this home.
Original Mortgage
$126,750
Interest Rate
6.92%
Mortgage Type
Purchase Money Mortgage
Create a Home Valuation Report for This Property
The Home Valuation Report is an in-depth analysis detailing your home's value as well as a comparison with similar homes in the area
Home Values in the Area
Average Home Value in this Area
Purchase History
| Date | Buyer | Sale Price | Title Company |
|---|---|---|---|
| Bardwell Thomas S | $249,000 | -- | |
| Fraser David J | $169,000 | -- |
Source: Public Records
Mortgage History
| Date | Status | Borrower | Loan Amount |
|---|---|---|---|
| Open | Fraser David J | $199,200 | |
| Previous Owner | Fraser David J | $126,750 |
Source: Public Records
Tax History Compared to Growth
Tax History
| Year | Tax Paid | Tax Assessment Tax Assessment Total Assessment is a certain percentage of the fair market value that is determined by local assessors to be the total taxable value of land and additions on the property. | Land | Improvement |
|---|---|---|---|---|
| 2024 | $7,767 | $280,500 | $116,100 | $164,400 |
| 2023 | $7,534 | $280,500 | $116,100 | $164,400 |
| 2022 | $7,262 | $280,500 | $116,100 | $164,400 |
| 2021 | $6,966 | $277,300 | $116,100 | $161,200 |
| 2020 | $6,754 | $252,400 | $101,800 | $150,600 |
| 2019 | $6,381 | $229,700 | $101,800 | $127,900 |
| 2018 | $6,168 | $218,800 | $105,300 | $113,500 |
| 2017 | $5,913 | $209,400 | $103,400 | $106,000 |
| 2016 | $5,587 | $201,900 | $103,400 | $98,500 |
| 2015 | $5,236 | $191,500 | $97,000 | $94,500 |
| 2014 | $5,134 | $191,500 | $97,000 | $94,500 |
| 2013 | $4,952 | $193,600 | $97,000 | $96,600 |
| 2012 | $4,901 | $201,100 | $106,100 | $95,000 |
Source: Public Records
Map
Nearby Homes
- 18 Holly St
- 15 Holly St
- 23 Holly St Unit 25
- 14 Holly St Unit 16
- 27 Holly St
- 27 Holly St Unit B
- 27 Holly St Unit A
- 27 Holly St Unit B
- 47 Dunklee St
- 9 Holly St Unit 11
- 12 Watson Ct Unit 14
- 49 Dunklee St
- 6-8 Holly St
- 29 Holly St
- 306 S Main St
- 7 Holly St
- 31 Holly St
- 4 Holly St
- 16 Watson Ct
- 53 Dunklee St