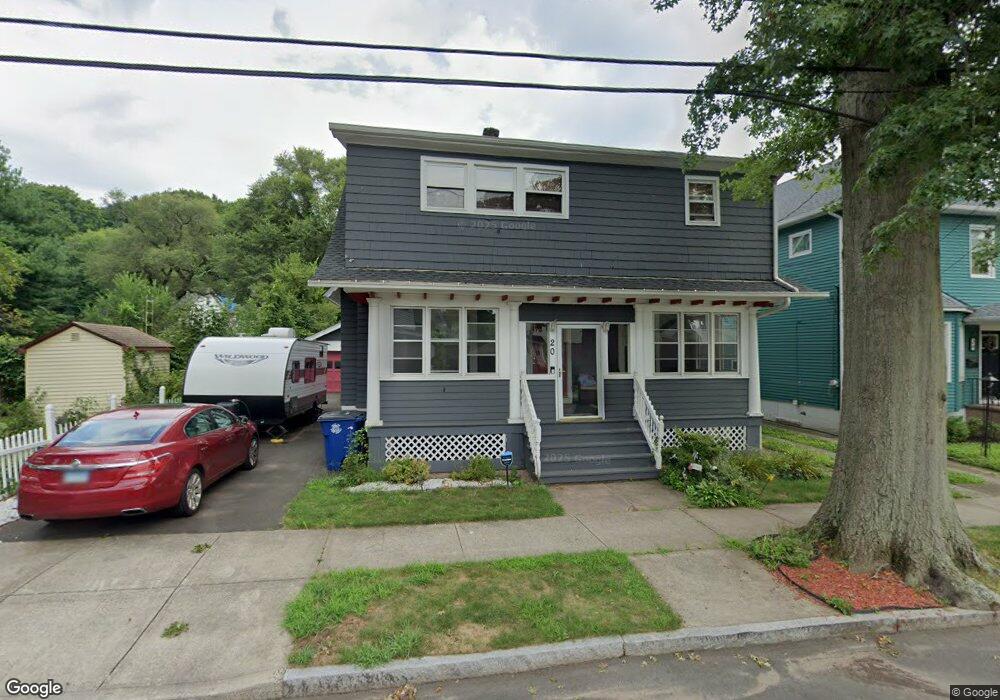
20 Irvington St New Haven, CT 06513
Fair Haven Heights NeighborhoodEstimated Value: $306,000 - $470,000
3
Beds
2
Baths
1,876
Sq Ft
$204/Sq Ft
Est. Value
About This Home
This home is located at 20 Irvington St, New Haven, CT 06513 and is currently estimated at $383,022, approximately $204 per square foot. 20 Irvington St is a home located in New Haven County with nearby schools including Ross Woodward, St Francis & St Rose Of Lima School, and Cold Spring School.
Ownership History
Date
Name
Owned For
Owner Type
Purchase Details
Closed on
Mar 31, 2010
Sold by
Avnd Llc
Bought by
Ransom Brenda
Current Estimated Value
Home Financials for this Owner
Home Financials are based on the most recent Mortgage that was taken out on this home.
Original Mortgage
$235,550
Outstanding Balance
$149,896
Interest Rate
4.12%
Mortgage Type
FHA
Estimated Equity
$233,126
Purchase Details
Closed on
Aug 31, 2009
Sold by
Nationstar Mortgage Ll
Bought by
Avnd Llc
Home Financials for this Owner
Home Financials are based on the most recent Mortgage that was taken out on this home.
Original Mortgage
$125,000
Interest Rate
5.17%
Purchase Details
Closed on
Oct 9, 2008
Sold by
Klinger Robert and Klinger Carmen
Bought by
Nationstar Mortgage Ll
Purchase Details
Closed on
Jul 28, 2003
Sold by
Lefkimiatis Nikolaos and Lefkimiatis Margaret A
Bought by
Klinger Robert
Create a Home Valuation Report for This Property
The Home Valuation Report is an in-depth analysis detailing your home's value as well as a comparison with similar homes in the area
Home Values in the Area
Average Home Value in this Area
Purchase History
| Date | Buyer | Sale Price | Title Company |
|---|---|---|---|
| Ransom Brenda | $239,900 | -- | |
| Avnd Llc | $83,475 | -- | |
| Nationstar Mortgage Ll | -- | -- | |
| Klinger Robert | $141,000 | -- |
Source: Public Records
Mortgage History
| Date | Status | Borrower | Loan Amount |
|---|---|---|---|
| Open | Klinger Robert | $235,550 | |
| Previous Owner | Klinger Robert | $125,000 | |
| Previous Owner | Klinger Robert | $8,000 |
Source: Public Records
Tax History Compared to Growth
Tax History
| Year | Tax Paid | Tax Assessment Tax Assessment Total Assessment is a certain percentage of the fair market value that is determined by local assessors to be the total taxable value of land and additions on the property. | Land | Improvement |
|---|---|---|---|---|
| 2025 | $8,379 | $212,660 | $39,480 | $173,180 |
| 2024 | $8,187 | $212,660 | $39,480 | $173,180 |
| 2023 | $7,911 | $212,660 | $39,480 | $173,180 |
| 2022 | $8,453 | $212,660 | $39,480 | $173,180 |
| 2021 | $7,181 | $163,660 | $25,830 | $137,830 |
| 2020 | $7,181 | $163,660 | $25,830 | $137,830 |
| 2019 | $7,034 | $163,660 | $25,830 | $137,830 |
| 2018 | $7,034 | $163,660 | $25,830 | $137,830 |
| 2017 | $6,330 | $163,660 | $25,830 | $137,830 |
| 2016 | $6,567 | $158,060 | $24,430 | $133,630 |
| 2015 | $6,567 | $158,060 | $24,430 | $133,630 |
| 2014 | $6,567 | $158,060 | $24,430 | $133,630 |
Source: Public Records
Map
Nearby Homes
- 20 Ashland Place
- 334 Prospect Ave Unit 334
- 74 Milton St
- 1117 Townsend Ave
- 28 Farren Ave
- 1090 Townsend Ave
- 172 Quinnipiac Ave
- 666 Woodward Ave Unit 666
- 225 Fulton Terrace
- 120 Harrington Ave
- 112 Harrington Ave
- 44 Huntington Ave
- 45 Huntington Ave
- 32 Huntington Ave
- 190 Farren Ave
- 193 Farren Ave
- 12 E Ferry St
- 196 Farren Ave
- 516 Woodward Ave
- 18 Lenox St
- 24 Irvington St
- 30 Irvington St
- 5 Burwell St
- 29 Burwell St
- 34 Irvington St
- 17 Irvington St
- 23 Irvington St
- 15 Irvington St
- 33 Burwell St
- 15 Chester St
- 38 Irvington St
- 29 Irvington St
- 1245 Townsend Ave
- 1269 Townsend Ave
- 19 Chester St
- 35 Irvington St
- 42 Irvington St
- 42 Burwell St
- 32 Burwell St
- 1273 Townsend Ave