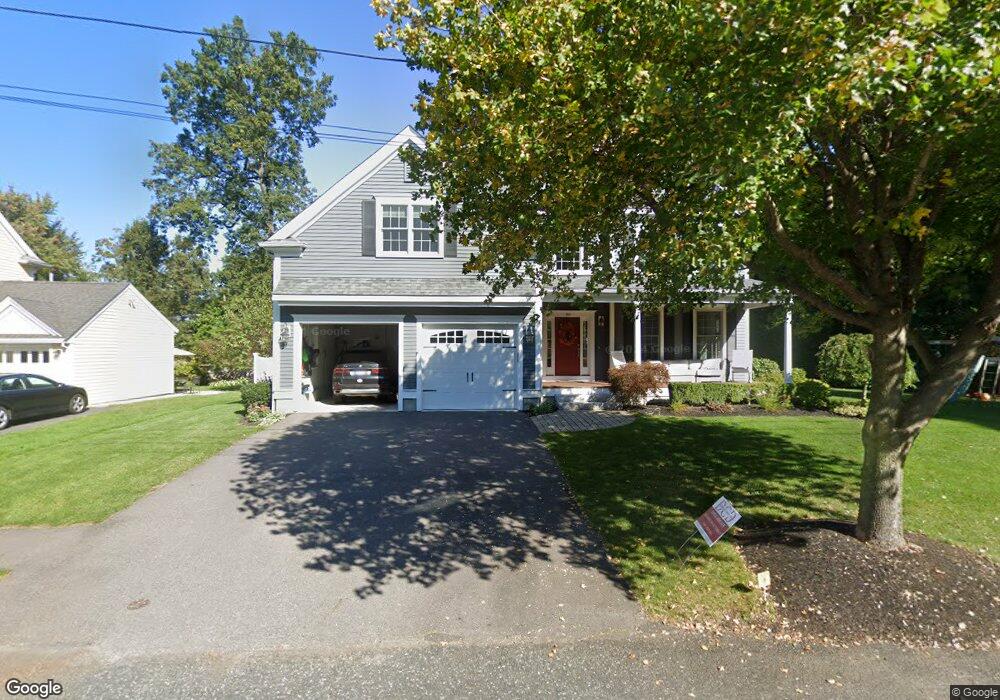
20 James Ave Needham Heights, MA 02494
Estimated Value: $2,516,157 - $2,635,000
5
Beds
6
Baths
1,819
Sq Ft
$1,425/Sq Ft
Est. Value
About This Home
This home is located at 20 James Ave, Needham Heights, MA 02494 and is currently estimated at $2,592,289, approximately $1,425 per square foot. 20 James Ave is a home located in Norfolk County with nearby schools including Mitchell Elementary School, High Rock Middle School, and Pollard Middle School.
Ownership History
Date
Name
Owned For
Owner Type
Purchase Details
Closed on
Nov 28, 2020
Sold by
Mcdonald Tara A
Bought by
T Ann Mcdonald 2020 Ret and Mcdonald
Current Estimated Value
Purchase Details
Closed on
Apr 2, 2010
Sold by
Collins James A and Collins Barbara J
Bought by
Collins James A and Collins Barbara J
Create a Home Valuation Report for This Property
The Home Valuation Report is an in-depth analysis detailing your home's value as well as a comparison with similar homes in the area
Home Values in the Area
Average Home Value in this Area
Purchase History
| Date | Buyer | Sale Price | Title Company |
|---|---|---|---|
| T Ann Mcdonald 2020 Ret | -- | None Available | |
| T Ann Mcdonald 2020 Ret | -- | None Available | |
| David Mcdonald 2020 Ret | -- | None Available | |
| Mcdonald Tara A | -- | None Available | |
| Collins James A | -- | -- | |
| Collins James A | -- | -- |
Source: Public Records
Mortgage History
| Date | Status | Borrower | Loan Amount |
|---|---|---|---|
| Previous Owner | Collins James A | $400,000 | |
| Previous Owner | Collins James A | $996,000 | |
| Previous Owner | Collins James A | $17,000 |
Source: Public Records
Tax History
| Year | Tax Paid | Tax Assessment Tax Assessment Total Assessment is a certain percentage of the fair market value that is determined by local assessors to be the total taxable value of land and additions on the property. | Land | Improvement |
|---|---|---|---|---|
| 2025 | $25,178 | $2,375,300 | $776,100 | $1,599,200 |
| 2024 | $21,373 | $1,707,100 | $554,400 | $1,152,700 |
| 2023 | $21,075 | $1,616,200 | $554,400 | $1,061,800 |
| 2022 | $19,925 | $1,490,300 | $486,600 | $1,003,700 |
| 2021 | $19,419 | $1,490,300 | $486,600 | $1,003,700 |
| 2020 | $18,706 | $1,497,700 | $486,600 | $1,011,100 |
| 2019 | $17,856 | $1,441,200 | $442,600 | $998,600 |
| 2018 | $17,121 | $1,441,200 | $442,600 | $998,600 |
| 2017 | $15,558 | $1,308,500 | $442,600 | $865,900 |
| 2016 | $15,210 | $1,318,000 | $443,300 | $874,700 |
| 2015 | $14,880 | $1,318,000 | $443,300 | $874,700 |
| 2014 | $12,966 | $1,113,900 | $403,300 | $710,600 |
Source: Public Records
Map
Nearby Homes
- 11 Holmes St
- 638 Webster St
- 638 Webster St Unit 638
- 510 Webster St
- 190 Brookline St
- 674 Webster St
- 17 Lindbergh Ave
- 55 Burnside Rd
- 24 Mellen St
- 58 Morton St
- 7 West St
- 19 Oakland Ave Unit 19
- 36 Otis St Unit 36
- 19 Highland Ct Unit 19
- 68 Brookline St
- 28 Mercer Rd
- 447 Hillside Ave
- 176 Highgate St
- 385 Hillside Ave
- 385 Hillside Ave Unit 385
- 14 James Ave
- 136 Lindbergh Ave
- 130 Lindbergh Ave
- 17 James Ave
- 23 James Ave
- 11 James Ave
- 148 Lindbergh Ave
- 8 James Ave
- 122 Lindbergh Ave
- 192 Manning St
- 135 Lindbergh Ave
- 131 Lindbergh Ave
- 143 Lindbergh Ave
- 116 Lindbergh Ave
- 116 Lindbergh Ave Unit 1
- 198 Manning St
- 277 Brookline St
- 147 Lindbergh Ave
- 202 Manning St
- 202 Manning St Unit 1
Your Personal Tour Guide
Ask me questions while you tour the home.