20 Keith Rd Pocasset, MA 02559
Pocasset NeighborhoodEstimated Value: $721,878 - $792,000
3
Beds
2
Baths
1,501
Sq Ft
$507/Sq Ft
Est. Value
About This Home
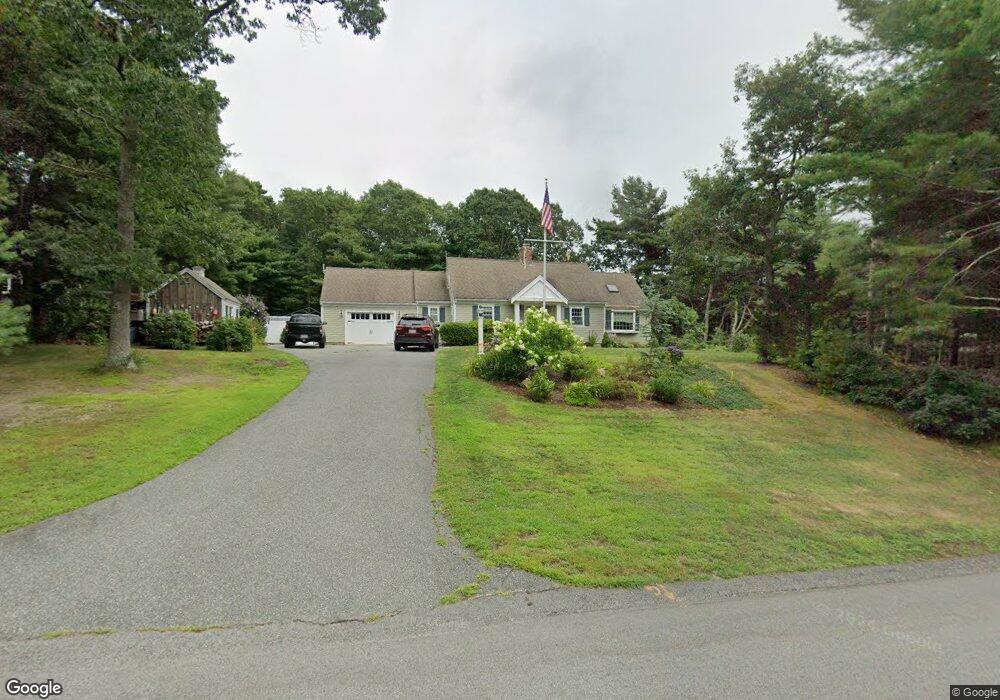
This home is located at 20 Keith Rd, Pocasset, MA 02559 and is currently estimated at $761,220, approximately $507 per square foot. 20 Keith Rd is a home located in Barnstable County with nearby schools including Bourne High School and Cadence Academy Preschool - Bourne.
Ownership History
Date
Name
Owned For
Owner Type
Purchase Details
Closed on
Feb 24, 2025
Sold by
Gustafson Herman R and Gustafson Diane E
Bought by
Gustafson
Current Estimated Value
Purchase Details
Closed on
Nov 30, 1993
Sold by
Khiralla George
Bought by
Gustafson Herman R and Gustafson Diane E
Home Financials for this Owner
Home Financials are based on the most recent Mortgage that was taken out on this home.
Original Mortgage
$120,000
Interest Rate
6.72%
Mortgage Type
Purchase Money Mortgage
Create a Home Valuation Report for This Property
The Home Valuation Report is an in-depth analysis detailing your home's value as well as a comparison with similar homes in the area
Home Values in the Area
Average Home Value in this Area
Purchase History
| Date | Buyer | Sale Price | Title Company |
|---|---|---|---|
| Gustafson | -- | None Available | |
| Gustafson | -- | None Available | |
| Gustafson Herman R | $135,000 | -- | |
| Gustafson Herman R | $135,000 | -- |
Source: Public Records
Mortgage History
| Date | Status | Borrower | Loan Amount |
|---|---|---|---|
| Previous Owner | Gustafson Herman R | $145,000 | |
| Previous Owner | Gustafson Herman R | $120,000 | |
| Previous Owner | Gustafson Herman R | $38,000 |
Source: Public Records
Tax History Compared to Growth
Tax History
| Year | Tax Paid | Tax Assessment Tax Assessment Total Assessment is a certain percentage of the fair market value that is determined by local assessors to be the total taxable value of land and additions on the property. | Land | Improvement |
|---|---|---|---|---|
| 2025 | $5,165 | $661,300 | $224,800 | $436,500 |
| 2024 | $5,050 | $629,700 | $214,100 | $415,600 |
| 2023 | $4,896 | $555,700 | $181,200 | $374,500 |
| 2022 | $5,027 | $498,200 | $196,800 | $301,400 |
| 2021 | $4,912 | $456,100 | $179,100 | $277,000 |
| 2020 | $4,625 | $430,600 | $177,400 | $253,200 |
| 2019 | $4,367 | $415,500 | $177,400 | $238,100 |
| 2018 | $4,183 | $396,900 | $169,000 | $227,900 |
| 2017 | $3,716 | $360,800 | $155,000 | $205,800 |
| 2016 | $3,630 | $357,300 | $155,000 | $202,300 |
| 2015 | $3,598 | $357,300 | $155,000 | $202,300 |
Source: Public Records
Map
Nearby Homes
- 254 Barlows Landing Rd
- 940 County Rd
- 709 County Rd
- 7 4th Ave
- 15 1st St
- 171 Bellavista Dr
- 39 Bennets Neck Dr
- 940 County Rd
- 14 Navajo Rd
- 34 Kenwood Rd
- 70 Wings Neck Rd
- 45 Kenwood Rd
- 22 Nairn Rd
- 3 Red Brook Pond Dr
- 48 Red Brook Harbor Rd
- 41 Portside Dr
- 515 County Rd
- 566 Shore Rd
- 89 Harbor Dr
- 1234 Route 28a