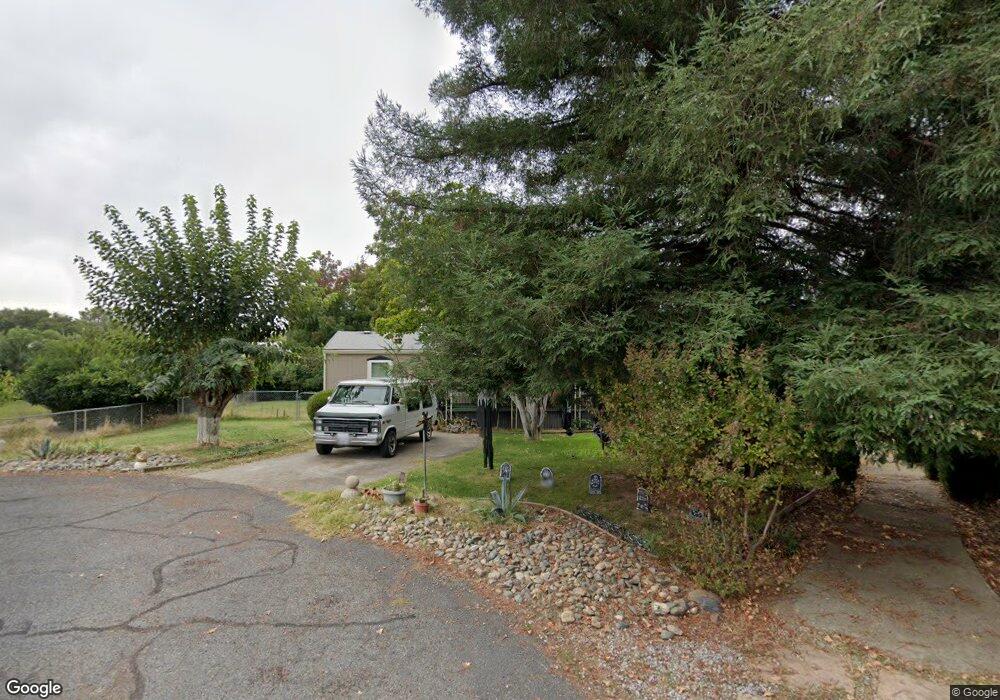
20 Kendel Ln Red Bluff, CA 96080
Estimated Value: $208,000 - $303,000
3
Beds
2
Baths
1,344
Sq Ft
$183/Sq Ft
Est. Value
About This Home
This home is located at 20 Kendel Ln, Red Bluff, CA 96080 and is currently estimated at $246,524, approximately $183 per square foot. 20 Kendel Ln is a home located in Tehama County with nearby schools including Antelope Elementary School, Berrendos Middle School, and Red Bluff High School.
Ownership History
Date
Name
Owned For
Owner Type
Purchase Details
Closed on
Oct 7, 2015
Sold by
Lightfoot David Rodell
Bought by
Lightfoot David Rodell
Current Estimated Value
Purchase Details
Closed on
Mar 4, 2014
Sold by
Bastion Us Homes I Llc
Bought by
Lightfoot Barbara J and The Lightfoot Trust
Purchase Details
Closed on
Aug 13, 2013
Sold by
Federal National Mortgage Association
Bought by
Bastion Us Homes I Llc
Purchase Details
Closed on
Aug 2, 2012
Sold by
Henderson Lloyd L
Bought by
Federal National Mortgage Association
Purchase Details
Closed on
Nov 29, 2007
Sold by
Henderson Lloyd L
Bought by
Henderson Lloyd
Home Financials for this Owner
Home Financials are based on the most recent Mortgage that was taken out on this home.
Original Mortgage
$55,384
Interest Rate
6.3%
Mortgage Type
New Conventional
Purchase Details
Closed on
Aug 17, 2007
Sold by
Henderson Lloyd
Bought by
Henderson Lloyd
Create a Home Valuation Report for This Property
The Home Valuation Report is an in-depth analysis detailing your home's value as well as a comparison with similar homes in the area
Purchase History
| Date | Buyer | Sale Price | Title Company |
|---|---|---|---|
| Lightfoot David Rodell | -- | None Available | |
| Lightfoot Barbara J | $112,500 | Placer Title Company | |
| Bastion Us Homes I Llc | $51,350 | Service Link | |
| Federal National Mortgage Association | $62,160 | Lawyers Title Company | |
| Henderson Lloyd | -- | Fidelity Natl Title Co Of Ca | |
| Henderson Lloyd L | -- | Fidelity Natl Title Co Of Ca | |
| Henderson Lloyd | -- | None Available |
Source: Public Records
Mortgage History
| Date | Status | Borrower | Loan Amount |
|---|---|---|---|
| Previous Owner | Henderson Lloyd L | $55,384 |
Source: Public Records
Tax History
| Year | Tax Paid | Tax Assessment Tax Assessment Total Assessment is a certain percentage of the fair market value that is determined by local assessors to be the total taxable value of land and additions on the property. | Land | Improvement |
|---|---|---|---|---|
| 2025 | $1,277 | $133,169 | $47,348 | $85,821 |
| 2023 | $1,258 | $128,000 | $45,510 | $82,490 |
| 2022 | $1,221 | $125,491 | $44,618 | $80,873 |
| 2021 | $1,198 | $123,032 | $43,744 | $79,288 |
| 2020 | $1,270 | $121,771 | $43,296 | $78,475 |
| 2019 | $1,265 | $119,385 | $42,448 | $76,937 |
| 2018 | $1,207 | $117,045 | $41,616 | $75,429 |
| 2017 | $1,218 | $114,750 | $40,800 | $73,950 |
| 2016 | $1,137 | $112,500 | $40,000 | $72,500 |
| 2015 | $1,089 | $114,747 | $40,799 | $73,948 |
| 2014 | $525 | $51,350 | $15,000 | $36,350 |
Source: Public Records
Map
Nearby Homes
- 176 Casa Grande Dr
- 139 Casa Grande Dr
- 147 Casa Grande Dr
- 1 Casa Grande Dr Unit 1
- 135 Casa Grande Dr
- 123 Casa Grande Dr
- 101 Casa Grande Dr
- 13 Casa Grande Dr
- 23 Casa Grande Dr
- Lot 1 Paynes Creek Rd
- 14115 Trinity Ave
- 000 Knob Hill Place
- 508 Antoinette Ct
- 108 Lot 8 of Tract No 91-1002 Ln
- 83 Damon Ave
- 125 Kimick Way
- 65 Mary Ln
- 105 Kimick Way
- 22560 Adobe Rd
- 13925 Noble Way
- 10 Kendel Ln
- 25 Kendel Ln
- 15 Kendel Ln
- 570 Rio Vista Ave
- 590 Rio Vista Ave
- 0 Rio Vista Ln
- 114 Casa Grande Dr
- 159 Casa Grande Dr
- 52 Rio Vista Ln
- 78 Casa Grande Dr
- 600 #90 Rio Vista Dr
- 113 Rio Vista Ln Unit 113
- 124 Casa Grande Dr
- 182 Casa Grande Dr
- 105 Rio Vista Ln
- 103 Rio Vista Ln
- 50 Rio Vista Ln
- 2 Rio Vista Ln
- 4 Rio Vista Ln
- 175 Casa Grande Dr
Your Personal Tour Guide
Ask me questions while you tour the home.