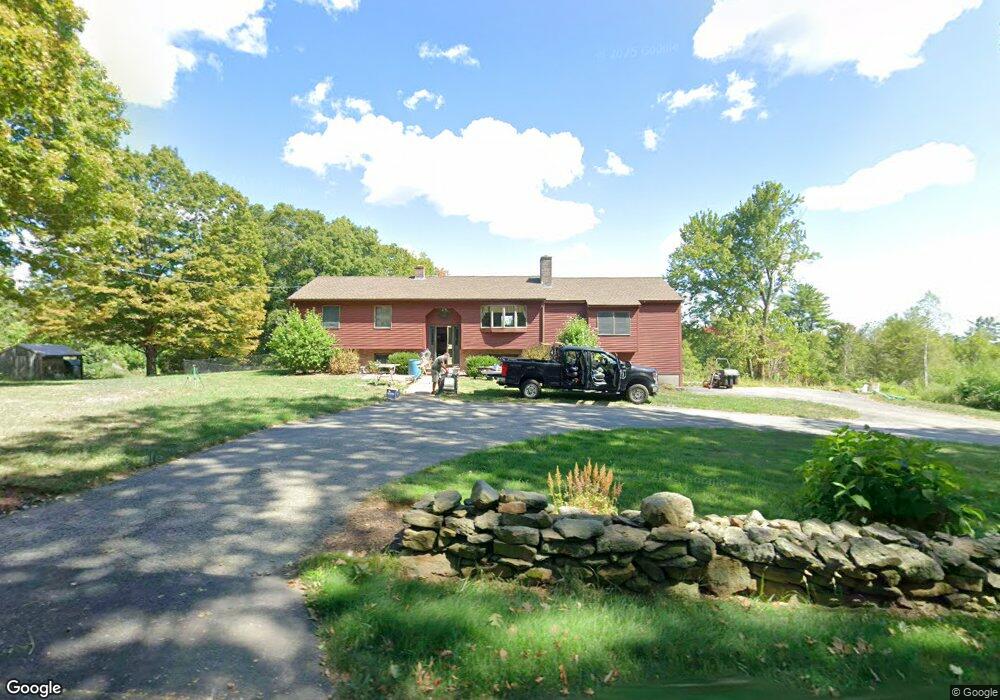
20 Kruse Rd Hubbardston, MA 01452
Estimated Value: $412,000 - $556,000
3
Beds
3
Baths
1,730
Sq Ft
$282/Sq Ft
Est. Value
About This Home
This home is located at 20 Kruse Rd, Hubbardston, MA 01452 and is currently estimated at $488,140, approximately $282 per square foot. 20 Kruse Rd is a home located in Worcester County with nearby schools including Quabbin Regional Middle School and Quabbin Regional High School.
Ownership History
Date
Name
Owned For
Owner Type
Purchase Details
Closed on
May 6, 2025
Sold by
Joan M Tattan Irt and Tattan
Bought by
Dupuis Stephanie and Donascimento Celio R
Current Estimated Value
Purchase Details
Closed on
Jul 18, 2019
Sold by
Hardaker Timothy R and Hardaker Sharon M
Bought by
Dupuis Stephanie A
Home Financials for this Owner
Home Financials are based on the most recent Mortgage that was taken out on this home.
Original Mortgage
$198,850
Interest Rate
3.82%
Mortgage Type
New Conventional
Purchase Details
Closed on
Jun 15, 1984
Bought by
Hardaker Timothy R and Beauvais Sharon
Create a Home Valuation Report for This Property
The Home Valuation Report is an in-depth analysis detailing your home's value as well as a comparison with similar homes in the area
Home Values in the Area
Average Home Value in this Area
Purchase History
| Date | Buyer | Sale Price | Title Company |
|---|---|---|---|
| Dupuis Stephanie | $180,000 | None Available | |
| Dupuis Stephanie | $180,000 | None Available | |
| Dupuis Stephanie A | $205,000 | -- | |
| Dupuis Stephanie A | $205,000 | -- | |
| Hardaker Timothy R | -- | -- |
Source: Public Records
Mortgage History
| Date | Status | Borrower | Loan Amount |
|---|---|---|---|
| Previous Owner | Dupuis Stephanie A | $198,850 | |
| Previous Owner | Hardaker Timothy R | $88,500 | |
| Previous Owner | Hardaker Timothy R | $105,000 | |
| Previous Owner | Hardaker Timothy R | $25,000 |
Source: Public Records
Tax History Compared to Growth
Tax History
| Year | Tax Paid | Tax Assessment Tax Assessment Total Assessment is a certain percentage of the fair market value that is determined by local assessors to be the total taxable value of land and additions on the property. | Land | Improvement |
|---|---|---|---|---|
| 2025 | $5,425 | $464,500 | $51,400 | $413,100 |
| 2024 | $5,149 | $436,700 | $46,400 | $390,300 |
| 2023 | $4,369 | $335,300 | $40,800 | $294,500 |
| 2022 | $4,694 | $335,300 | $40,800 | $294,500 |
| 2021 | $4,561 | $308,000 | $40,800 | $267,200 |
| 2020 | $4,530 | $305,700 | $40,800 | $264,900 |
| 2019 | $4,240 | $278,600 | $55,200 | $223,400 |
| 2018 | $4,147 | $274,100 | $55,200 | $218,900 |
| 2017 | $4,175 | $274,100 | $55,200 | $218,900 |
| 2016 | $4,020 | $252,800 | $55,200 | $197,600 |
| 2015 | $3,984 | $267,000 | $55,200 | $211,800 |
| 2014 | $3,897 | $268,400 | $55,200 | $213,200 |
Source: Public Records
Map
Nearby Homes