Estimated Value: $320,000 - $346,000
--
Bed
3
Baths
1,885
Sq Ft
$179/Sq Ft
Est. Value
About This Home
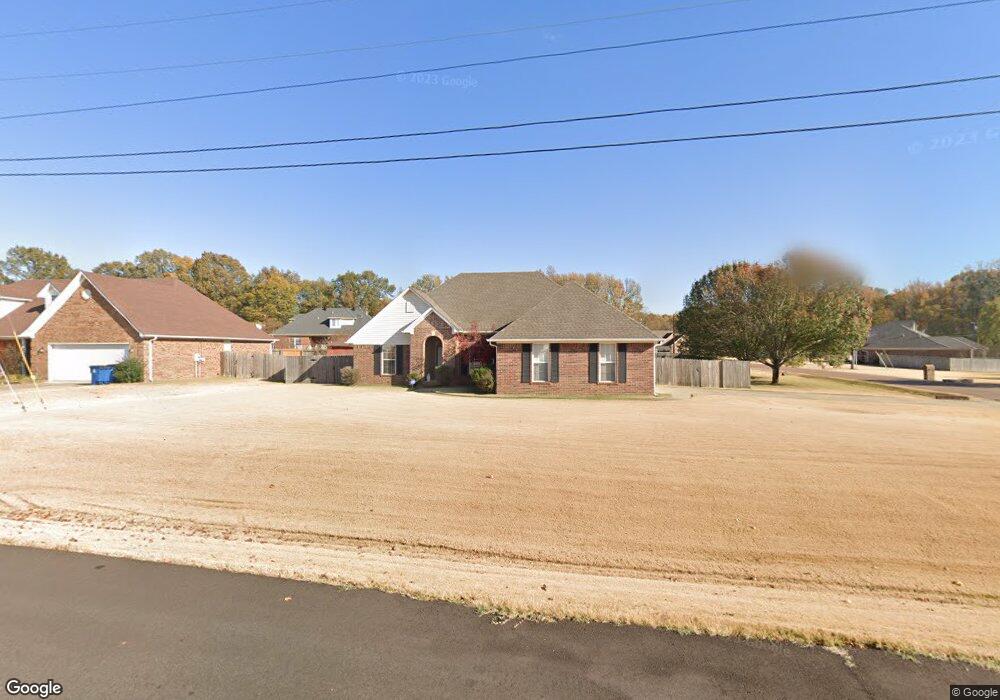
This home is located at 20 Lauren Cove, Atoka, TN 38004 and is currently estimated at $336,918, approximately $178 per square foot. 20 Lauren Cove is a home located in Tipton County with nearby schools including Atoka Elementary School, Brighton Middle School, and Brighton High School.
Ownership History
Date
Name
Owned For
Owner Type
Purchase Details
Closed on
Nov 20, 2024
Sold by
Gilbert George A and Dacus Amanda Kristen
Bought by
Mcculley Jacob Lee and Mcculley Madison Rae
Current Estimated Value
Home Financials for this Owner
Home Financials are based on the most recent Mortgage that was taken out on this home.
Original Mortgage
$195,000
Outstanding Balance
$193,131
Interest Rate
6.32%
Mortgage Type
VA
Estimated Equity
$143,787
Purchase Details
Closed on
Jun 22, 2015
Sold by
Gilbert Mary Sue
Bought by
Gilbert Mary Sue and Gilbert George A
Purchase Details
Closed on
Apr 30, 2003
Sold by
Jordan William L
Bought by
Gilbert Mary S
Purchase Details
Closed on
Oct 30, 2002
Sold by
Munford Development Co
Bought by
Jordan William L
Create a Home Valuation Report for This Property
The Home Valuation Report is an in-depth analysis detailing your home's value as well as a comparison with similar homes in the area
Home Values in the Area
Average Home Value in this Area
Purchase History
| Date | Buyer | Sale Price | Title Company |
|---|---|---|---|
| Mcculley Jacob Lee | $345,000 | None Listed On Document | |
| Mcculley Jacob Lee | $345,000 | None Listed On Document | |
| Mcculley Jacob Lee | $345,000 | None Listed On Document | |
| Gilbert Mary Sue | -- | -- | |
| Gilbert Mary S | $143,000 | -- | |
| Jordan William L | $15,000 | -- |
Source: Public Records
Mortgage History
| Date | Status | Borrower | Loan Amount |
|---|---|---|---|
| Open | Mcculley Jacob Lee | $195,000 | |
| Closed | Mcculley Jacob Lee | $195,000 |
Source: Public Records
Tax History Compared to Growth
Tax History
| Year | Tax Paid | Tax Assessment Tax Assessment Total Assessment is a certain percentage of the fair market value that is determined by local assessors to be the total taxable value of land and additions on the property. | Land | Improvement |
|---|---|---|---|---|
| 2024 | $1,565 | $69,375 | $8,675 | $60,700 |
| 2023 | $1,565 | $69,375 | $8,675 | $60,700 |
| 2022 | $1,490 | $48,525 | $6,375 | $42,150 |
| 2021 | $1,465 | $48,525 | $6,375 | $42,150 |
| 2020 | $1,465 | $48,525 | $6,375 | $42,150 |
| 2019 | $1,498 | $41,725 | $6,375 | $35,350 |
| 2018 | $1,498 | $41,725 | $6,375 | $35,350 |
| 2017 | $1,344 | $41,725 | $6,375 | $35,350 |
| 2016 | $1,344 | $41,725 | $6,375 | $35,350 |
| 2015 | $1,342 | $41,725 | $6,375 | $35,350 |
| 2014 | -- | $41,727 | $0 | $0 |
Source: Public Records
Map
Nearby Homes
- 1240 Je Blaydes Pkwy
- 343 Brittany Ln
- 107 Farmer Trail
- 438 Brittany Ln
- 512 Kearns Cir
- 665 Betty Boyd Ln
- 33 Hattie Ln
- 36 Hattie Ln
- 242 Timothy Rd
- 0 Smith Dr Unit 10202728
- 00 Atoka Idaville Rd
- 246 Betty Boyd Ln
- 420 Trebing Pkwy
- 210 Duncan Dr
- 33 Ward Ln
- 0 Meade Lake Rd Unit 10196514
- 91 Bethel Rd
- 215 Walker Pkwy
- 298 Anita Dr
- 461 Blaydes Dr
- 32 Lauren Cove
- 487 Farmer Trail
- 471 Farmer Trail
- 61 Gullet Cove
- 23 Gullet Cove
- 19 Lauren Cove
- 48 Lauren Cove
- 81 Gullet Cove
- 43 Lauren Cove
- 453 Farmer Trail
- 101 Gullet Cove
- 59 Lauren Cove
- 429 Farmer Trail
- 140 Gullet Cove
- 480 Farmer Trail
- 498 Farmer Trail
- 119 Gullet Cove
- 460 Farmer Trail
- 77 Lauren Cove
- 522 Farmer Trail