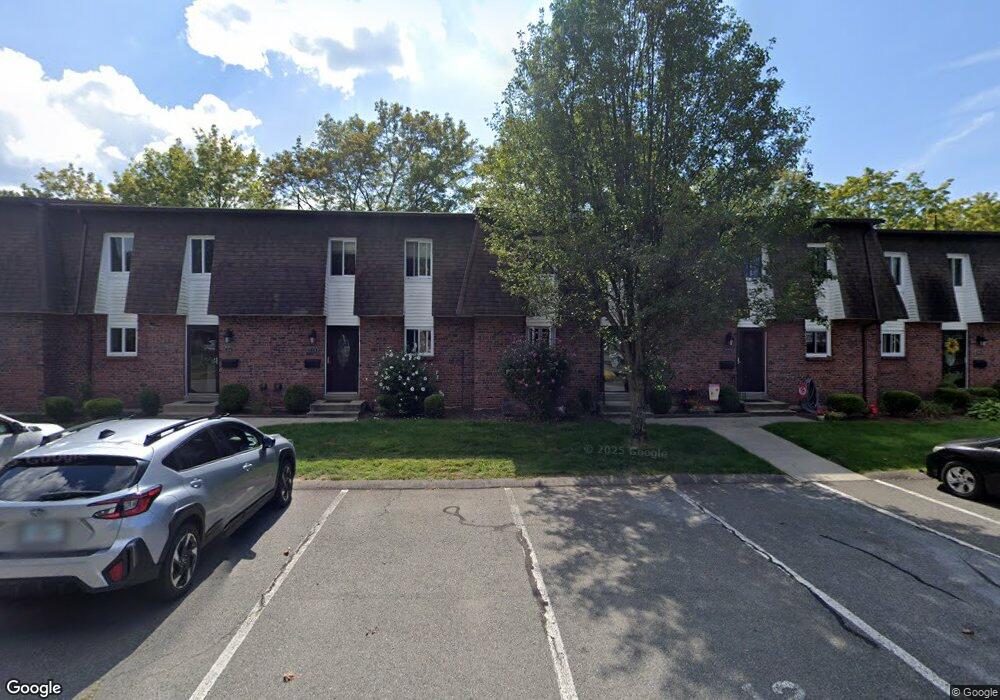
20 Lawrence Ave Unit 46 South Hadley, MA 01075
Estimated Value: $196,000 - $258,000
2
Beds
2
Baths
1,216
Sq Ft
$194/Sq Ft
Est. Value
About This Home
This home is located at 20 Lawrence Ave Unit 46, South Hadley, MA 01075 and is currently estimated at $236,510, approximately $194 per square foot. 20 Lawrence Ave Unit 46 is a home located in Hampshire County with nearby schools including Plains Elementary School, Mosier Elementary School, and Michael E. Smith Middle School.
Ownership History
Date
Name
Owned For
Owner Type
Purchase Details
Closed on
Feb 4, 2022
Sold by
Thiel Wesley A
Bought by
Tsering Sonam
Current Estimated Value
Home Financials for this Owner
Home Financials are based on the most recent Mortgage that was taken out on this home.
Original Mortgage
$127,200
Outstanding Balance
$117,971
Interest Rate
3.45%
Mortgage Type
Purchase Money Mortgage
Estimated Equity
$118,539
Purchase Details
Closed on
Feb 2, 2022
Sold by
Thiel Wesley A and Thiel Megan J
Bought by
Thiel Wesley A
Home Financials for this Owner
Home Financials are based on the most recent Mortgage that was taken out on this home.
Original Mortgage
$127,200
Outstanding Balance
$117,971
Interest Rate
3.45%
Mortgage Type
Purchase Money Mortgage
Estimated Equity
$118,539
Purchase Details
Closed on
Feb 27, 2004
Sold by
Ellinwood Dawn M
Bought by
Thiel Wesley A and Thiel Megan J
Home Financials for this Owner
Home Financials are based on the most recent Mortgage that was taken out on this home.
Original Mortgage
$96,000
Interest Rate
5.65%
Mortgage Type
Purchase Money Mortgage
Purchase Details
Closed on
May 28, 1996
Sold by
Kille Kristina M
Bought by
Peoples Sb
Create a Home Valuation Report for This Property
The Home Valuation Report is an in-depth analysis detailing your home's value as well as a comparison with similar homes in the area
Home Values in the Area
Average Home Value in this Area
Purchase History
| Date | Buyer | Sale Price | Title Company |
|---|---|---|---|
| Tsering Sonam | $159,000 | None Available | |
| Thiel Wesley A | -- | None Available | |
| Thiel Wesley A | $120,000 | -- | |
| Peoples Sb | $76,576 | -- |
Source: Public Records
Mortgage History
| Date | Status | Borrower | Loan Amount |
|---|---|---|---|
| Open | Tsering Sonam | $127,200 | |
| Previous Owner | Peoples Sb | $93,362 | |
| Previous Owner | Peoples Sb | $96,000 |
Source: Public Records
Tax History Compared to Growth
Tax History
| Year | Tax Paid | Tax Assessment Tax Assessment Total Assessment is a certain percentage of the fair market value that is determined by local assessors to be the total taxable value of land and additions on the property. | Land | Improvement |
|---|---|---|---|---|
| 2025 | $3,315 | $208,100 | $0 | $208,100 |
| 2024 | $2,842 | $170,700 | $0 | $170,700 |
| 2023 | $2,622 | $149,400 | $0 | $149,400 |
| 2022 | $2,927 | $158,400 | $0 | $158,400 |
| 2021 | $2,878 | $147,900 | $0 | $147,900 |
| 2020 | $2,810 | $140,900 | $0 | $140,900 |
| 2019 | $2,682 | $133,100 | $0 | $133,100 |
| 2018 | $2,653 | $133,100 | $0 | $133,100 |
| 2017 | $2,678 | $133,100 | $0 | $133,100 |
| 2016 | $2,729 | $137,500 | $0 | $137,500 |
| 2015 | $2,587 | $133,500 | $0 | $133,500 |
Source: Public Records
Map
Nearby Homes
- 133 Granby Rd
- 45 Shadow Brook Estate
- 32 North St
- 7 Hunter Terrace
- 3 Ralph Ave
- 0 Granby Rd
- 318 Newton St
- 27 Bardwell St Unit 4
- 63 Washington Ave
- 49 N Main St
- 30 Yale St
- 70 Lathrop St
- 73 Yorktown Ct
- 55 Dowds Ln
- 84 Judd Ave
- 64 Dowds Ln
- 48 N Canal St
- 41 W Summit St Unit 72
- 41 W Summit St Unit 54
- 41 W Summit St Unit 32
- 20 Lawrence Ave Unit 60
- 20 Lawrence Ave Unit 59
- 20 Lawrence Ave Unit 58
- 20 Lawrence Ave Unit 57
- 20 Lawrence Ave Unit 56
- 20 Lawrence Ave Unit 55
- 20 Lawrence Ave Unit 54
- 20 Lawrence Ave Unit 53
- 20 Lawrence Ave Unit 52
- 20 Lawrence Ave Unit 51
- 20 Lawrence Ave Unit 50
- 20 Lawrence Ave Unit 49
- 20 Lawrence Ave Unit 48
- 20 Lawrence Ave Unit 47
- 20 Lawrence Ave Unit 45
- 20 Lawrence Ave Unit 44
- 20 Lawrence Ave Unit 43
- 20 Lawrence Ave Unit 42
- 20 Lawrence Ave Unit 41
- 20 Lawrence Ave Unit 40D