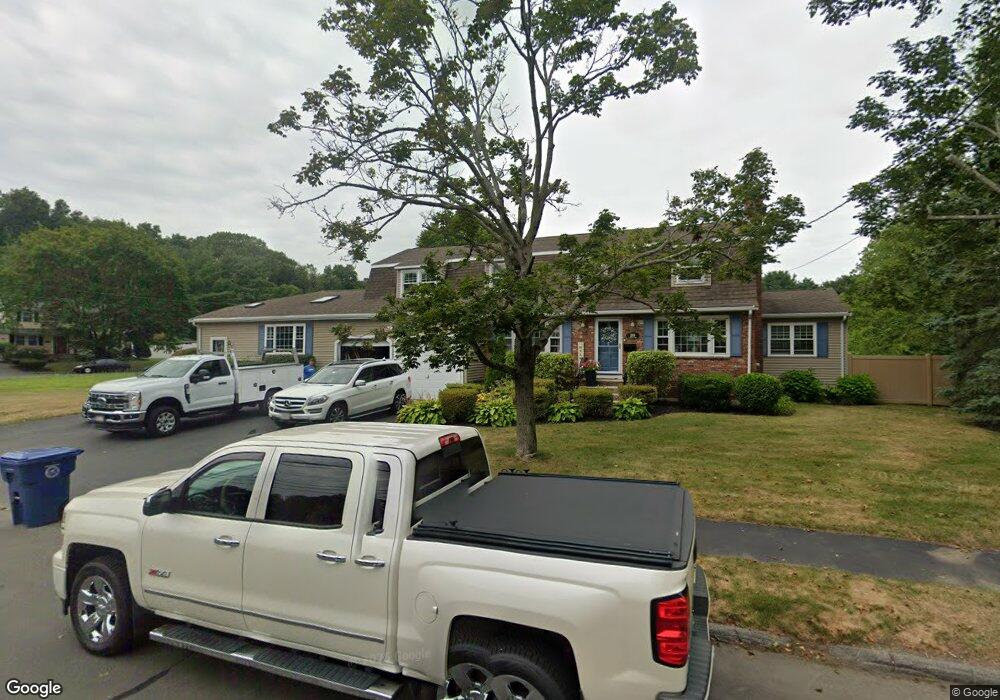
20 Longbow Rd Danvers, MA 01923
Estimated Value: $893,000 - $1,023,050
5
Beds
4
Baths
3,018
Sq Ft
$320/Sq Ft
Est. Value
About This Home
This home is located at 20 Longbow Rd, Danvers, MA 01923 and is currently estimated at $964,513, approximately $319 per square foot. 20 Longbow Rd is a home located in Essex County with nearby schools including Danvers High School, St. Mary of the Annunciation School, and St. John's Prep.
Ownership History
Date
Name
Owned For
Owner Type
Purchase Details
Closed on
Nov 1, 2013
Sold by
Thompson Glen E and Thompson Anneliese F
Bought by
20 Longbow Lt and Thopmson Glen E
Current Estimated Value
Purchase Details
Closed on
Jan 21, 2004
Sold by
Macdonald Kathleen M
Bought by
Macdonald Kathleen M
Purchase Details
Closed on
Mar 10, 2003
Sold by
Helinski Robert D
Bought by
Thompson Glen E and Thompson Anneliese F
Create a Home Valuation Report for This Property
The Home Valuation Report is an in-depth analysis detailing your home's value as well as a comparison with similar homes in the area
Home Values in the Area
Average Home Value in this Area
Purchase History
| Date | Buyer | Sale Price | Title Company |
|---|---|---|---|
| 20 Longbow Lt | -- | -- | |
| Macdonald Kathleen M | -- | -- | |
| Thompson Glen E | $420,000 | -- |
Source: Public Records
Mortgage History
| Date | Status | Borrower | Loan Amount |
|---|---|---|---|
| Previous Owner | Thompson Glen E | $50,000 | |
| Previous Owner | Thompson Glen E | $222,000 |
Source: Public Records
Tax History
| Year | Tax Paid | Tax Assessment Tax Assessment Total Assessment is a certain percentage of the fair market value that is determined by local assessors to be the total taxable value of land and additions on the property. | Land | Improvement |
|---|---|---|---|---|
| 2025 | $10,089 | $918,000 | $405,300 | $512,700 |
| 2024 | $9,946 | $895,200 | $398,600 | $496,600 |
| 2023 | $9,471 | $806,000 | $364,800 | $441,200 |
| 2022 | $9,314 | $735,700 | $324,300 | $411,400 |
| 2021 | $8,888 | $665,800 | $320,300 | $345,500 |
| 2020 | $8,911 | $682,300 | $320,300 | $362,000 |
| 2019 | $8,535 | $642,700 | $290,600 | $352,100 |
| 2018 | $8,376 | $618,600 | $290,600 | $328,000 |
| 2017 | $7,917 | $557,900 | $250,100 | $307,800 |
| 2016 | $7,623 | $536,800 | $236,600 | $300,200 |
| 2015 | $7,431 | $498,400 | $216,300 | $282,100 |
Source: Public Records
Map
Nearby Homes
Your Personal Tour Guide
Ask me questions while you tour the home.