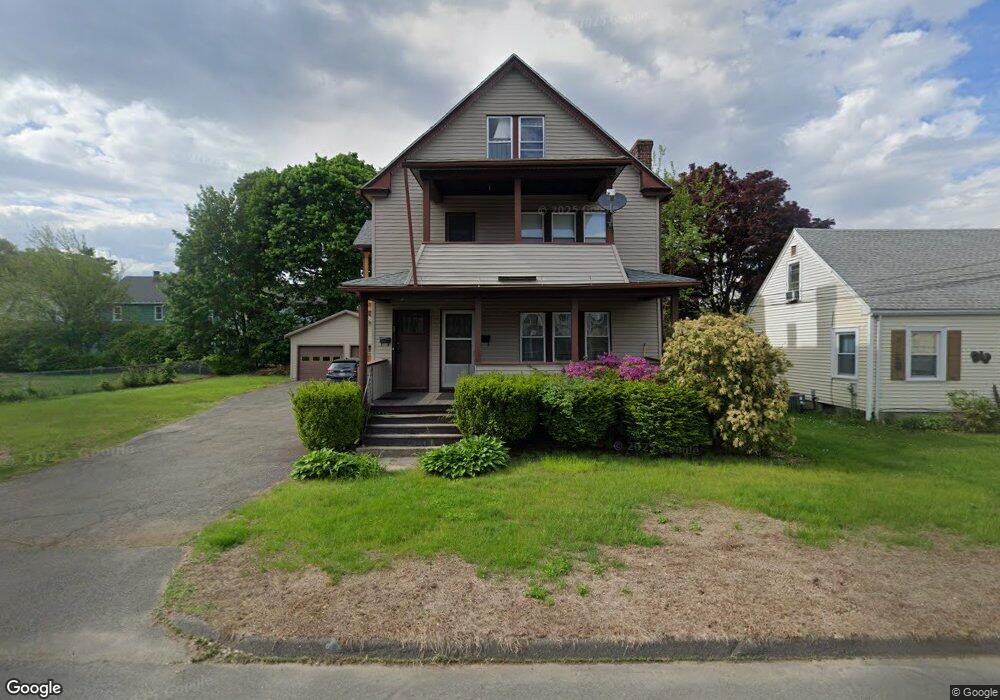
20 Maple St West Springfield, MA 01089
Estimated Value: $362,717 - $447,000
5
Beds
2
Baths
2,756
Sq Ft
$148/Sq Ft
Est. Value
About This Home
This home is located at 20 Maple St, West Springfield, MA 01089 and is currently estimated at $407,179, approximately $147 per square foot. 20 Maple St is a home located in Hampden County with nearby schools including West Springfield High School, Hampden Charter School of Science West, and St Thomas The Apostle School.
Ownership History
Date
Name
Owned For
Owner Type
Purchase Details
Closed on
Jun 30, 2017
Sold by
Giustina Robert N and Giustina Joyce M
Bought by
Guindon Eric R
Current Estimated Value
Home Financials for this Owner
Home Financials are based on the most recent Mortgage that was taken out on this home.
Original Mortgage
$160,000
Outstanding Balance
$133,405
Interest Rate
4.02%
Mortgage Type
New Conventional
Estimated Equity
$273,774
Purchase Details
Closed on
May 12, 2017
Sold by
Leitao Diane M and Marsh Mary J
Bought by
Giustina Joyce M
Home Financials for this Owner
Home Financials are based on the most recent Mortgage that was taken out on this home.
Original Mortgage
$160,000
Outstanding Balance
$133,405
Interest Rate
4.02%
Mortgage Type
New Conventional
Estimated Equity
$273,774
Purchase Details
Closed on
Apr 22, 2016
Sold by
Giustina Robert N and Giustina Joyce M
Bought by
Leitao Diane M and Marsh Mary J
Create a Home Valuation Report for This Property
The Home Valuation Report is an in-depth analysis detailing your home's value as well as a comparison with similar homes in the area
Home Values in the Area
Average Home Value in this Area
Purchase History
| Date | Buyer | Sale Price | Title Company |
|---|---|---|---|
| Guindon Eric R | $200,000 | -- | |
| Giustina Joyce M | -- | -- | |
| Leitao Diane M | -- | -- |
Source: Public Records
Mortgage History
| Date | Status | Borrower | Loan Amount |
|---|---|---|---|
| Open | Guindon Eric R | $160,000 |
Source: Public Records
Tax History
| Year | Tax Paid | Tax Assessment Tax Assessment Total Assessment is a certain percentage of the fair market value that is determined by local assessors to be the total taxable value of land and additions on the property. | Land | Improvement |
|---|---|---|---|---|
| 2025 | $4,804 | $323,100 | $97,900 | $225,200 |
| 2024 | $4,785 | $323,100 | $97,900 | $225,200 |
| 2023 | $4,300 | $276,700 | $95,800 | $180,900 |
| 2022 | $4,222 | $267,900 | $87,000 | $180,900 |
| 2021 | $3,617 | $214,000 | $79,400 | $134,600 |
| 2020 | $3,636 | $214,000 | $79,400 | $134,600 |
| 2019 | $3,629 | $214,000 | $79,400 | $134,600 |
| 2018 | $3,732 | $218,900 | $79,400 | $139,500 |
| 2017 | $3,732 | $218,900 | $79,400 | $139,500 |
| 2016 | $3,639 | $214,200 | $74,700 | $139,500 |
| 2015 | $3,571 | $210,200 | $73,200 | $137,000 |
| 2014 | $3,449 | $210,200 | $73,200 | $137,000 |
Source: Public Records
Map
Nearby Homes
Your Personal Tour Guide
Ask me questions while you tour the home.