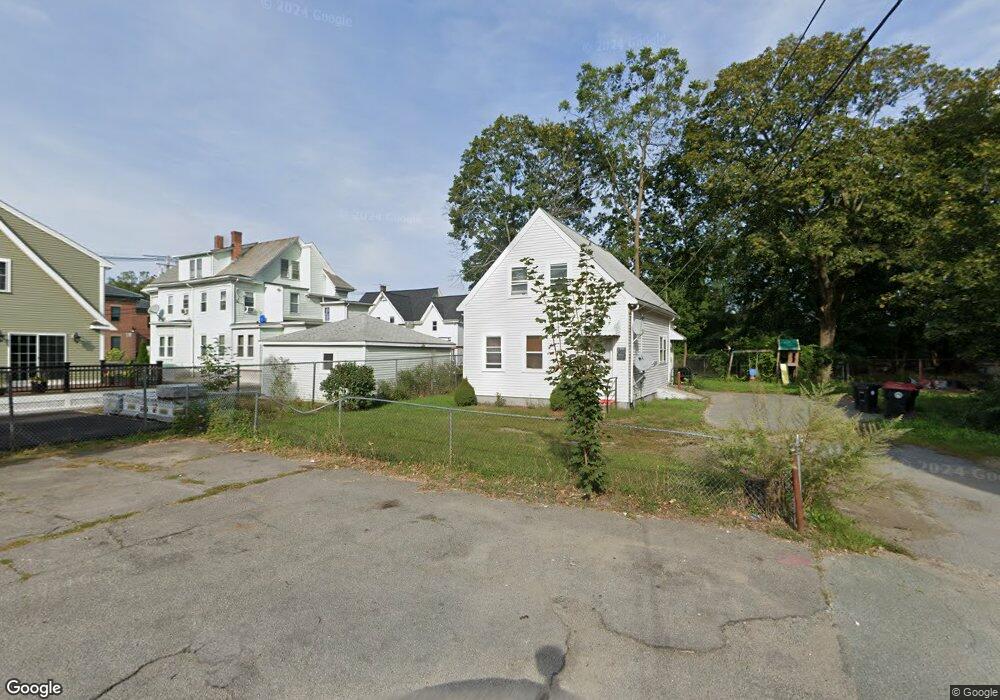
20 Martin Place Unit 1 Brockton, MA 02301
Clifton Heights NeighborhoodEstimated Value: $348,000 - $576,000
3
Beds
1
Bath
800
Sq Ft
$556/Sq Ft
Est. Value
About This Home
This home is located at 20 Martin Place Unit 1, Brockton, MA 02301 and is currently estimated at $445,034, approximately $556 per square foot. 20 Martin Place Unit 1 is a home located in Plymouth County with nearby schools including John F. Kennedy Elementary School, Davis K-8 School, and South Middle School.
Ownership History
Date
Name
Owned For
Owner Type
Purchase Details
Closed on
May 30, 2002
Sold by
20 Martin Place Rt
Bought by
Blaikie Frank C and Blaikie Judith A
Current Estimated Value
Home Financials for this Owner
Home Financials are based on the most recent Mortgage that was taken out on this home.
Original Mortgage
$158,949
Interest Rate
7%
Mortgage Type
Purchase Money Mortgage
Purchase Details
Closed on
Sep 7, 1999
Sold by
Brown Patricia M and Giard Paul M
Bought by
20 Martin Place Rt
Create a Home Valuation Report for This Property
The Home Valuation Report is an in-depth analysis detailing your home's value as well as a comparison with similar homes in the area
Home Values in the Area
Average Home Value in this Area
Purchase History
| Date | Buyer | Sale Price | Title Company |
|---|---|---|---|
| Blaikie Frank C | $161,500 | -- | |
| 20 Martin Place Rt | $30,000 | -- |
Source: Public Records
Mortgage History
| Date | Status | Borrower | Loan Amount |
|---|---|---|---|
| Open | 20 Martin Place Rt | $161,332 | |
| Closed | 20 Martin Place Rt | $158,949 |
Source: Public Records
Tax History Compared to Growth
Tax History
| Year | Tax Paid | Tax Assessment Tax Assessment Total Assessment is a certain percentage of the fair market value that is determined by local assessors to be the total taxable value of land and additions on the property. | Land | Improvement |
|---|---|---|---|---|
| 2025 | $3,673 | $303,300 | $140,000 | $163,300 |
| 2024 | $3,565 | $296,600 | $140,000 | $156,600 |
| 2023 | $3,514 | $270,700 | $104,100 | $166,600 |
| 2022 | $3,224 | $230,800 | $94,600 | $136,200 |
| 2021 | $2,920 | $201,400 | $78,500 | $122,900 |
| 2020 | $2,747 | $181,300 | $73,600 | $107,700 |
| 2019 | $2,482 | $159,700 | $71,800 | $87,900 |
| 2018 | $2,430 | $151,300 | $71,800 | $79,500 |
| 2017 | $2,196 | $136,400 | $71,800 | $64,600 |
| 2016 | $1,941 | $111,800 | $69,600 | $42,200 |
| 2015 | $1,808 | $99,600 | $69,600 | $30,000 |
| 2014 | $1,760 | $97,100 | $69,600 | $27,500 |
Source: Public Records
Map
Nearby Homes