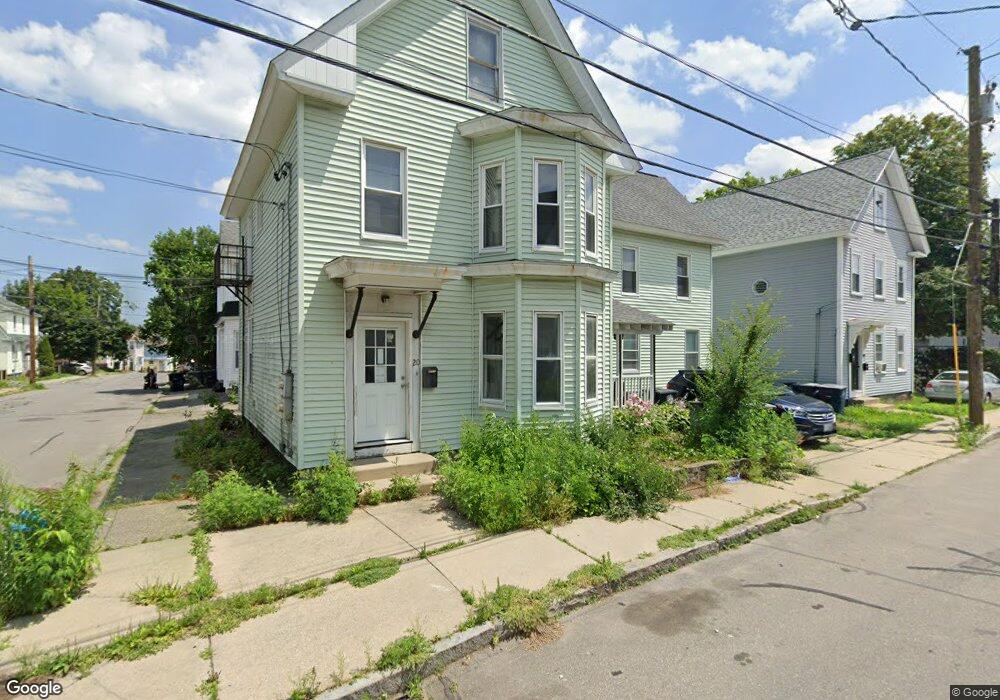
20 Mason St Nashua, NH 03060
Downtown Nashua NeighborhoodEstimated Value: $444,486 - $549,000
10
Beds
2
Baths
2,010
Sq Ft
$247/Sq Ft
Est. Value
About This Home
This home is located at 20 Mason St, Nashua, NH 03060 and is currently estimated at $497,372, approximately $247 per square foot. 20 Mason St is a home located in Hillsborough County with nearby schools including Amherst Street School, Pennichuck Middle School, and Nashua High School North.
Ownership History
Date
Name
Owned For
Owner Type
Purchase Details
Closed on
Mar 1, 2002
Sold by
Beecham Bruce
Bought by
Williams Jo-Reese
Current Estimated Value
Home Financials for this Owner
Home Financials are based on the most recent Mortgage that was taken out on this home.
Original Mortgage
$167,650
Outstanding Balance
$68,292
Interest Rate
6.85%
Estimated Equity
$429,080
Create a Home Valuation Report for This Property
The Home Valuation Report is an in-depth analysis detailing your home's value as well as a comparison with similar homes in the area
Home Values in the Area
Average Home Value in this Area
Purchase History
| Date | Buyer | Sale Price | Title Company |
|---|---|---|---|
| Williams Jo-Reese | $164,400 | -- |
Source: Public Records
Mortgage History
| Date | Status | Borrower | Loan Amount |
|---|---|---|---|
| Open | Williams Jo-Reese | $21,290 | |
| Open | Williams Jo-Reese | $167,650 |
Source: Public Records
Tax History Compared to Growth
Tax History
| Year | Tax Paid | Tax Assessment Tax Assessment Total Assessment is a certain percentage of the fair market value that is determined by local assessors to be the total taxable value of land and additions on the property. | Land | Improvement |
|---|---|---|---|---|
| 2024 | $6,619 | $416,300 | $102,900 | $313,400 |
| 2023 | $6,144 | $337,000 | $82,300 | $254,700 |
| 2022 | $6,090 | $337,000 | $82,300 | $254,700 |
| 2021 | $4,909 | $211,400 | $52,100 | $159,300 |
| 2020 | $4,875 | $215,600 | $52,100 | $163,500 |
| 2019 | $4,691 | $215,600 | $52,100 | $163,500 |
| 2018 | $4,573 | $215,600 | $52,100 | $163,500 |
| 2017 | $3,719 | $144,200 | $51,500 | $92,700 |
| 2016 | $3,615 | $144,200 | $51,500 | $92,700 |
| 2015 | $3,537 | $144,200 | $51,500 | $92,700 |
| 2014 | $3,468 | $144,200 | $51,500 | $92,700 |
Source: Public Records
Map
Nearby Homes
- 18 Harbor Ave Unit 208
- 13 Mulvanity St
- 5 Mulberry St
- 24 E Otterson St
- 2 Lyons St
- 65 Allds St
- 8 Buck St Unit 10
- 13 Sapphire Ln
- 4 Chase St
- 38 Central St
- 15 Atherton Ave
- 19 Atherton Ave
- 11 Charles St
- 30 Ledge St
- 22 Wilder St
- 121 Palm St
- 29 Wilder St
- 15 Lovell St Unit 20
- 15 Lovell St Unit 3
- 15 Lovell St Unit 7
- 1 Worcester St
- 3 Worcester St Unit 1
- 3 Worcester St
- 18 Mason St Unit 68
- 18 Mason St Unit 2
- 15 Mason St
- 55 Worcester St Unit 57
- 8 Worcester St Unit 71
- 5 1/2 Worcester St
- 13 Mason St
- 13 Mason St
- 17 Mason St
- 9-11 Mason St
- 9 Mason St Unit 11
- 19 Mason St
- 10 Foundry St
- 7 1/2 Worcester St
- 10 Worcester St
- 14 Mason St
- 9 Worcester St Unit 11