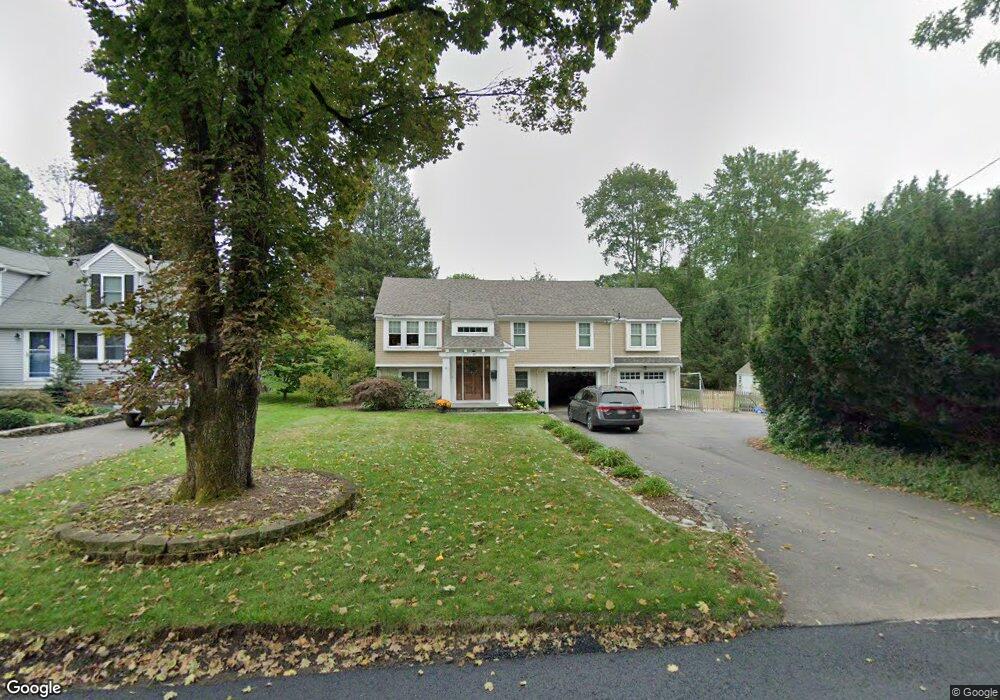
20 Moore St Natick, MA 01760
Estimated Value: $799,000 - $1,463,000
3
Beds
2
Baths
1,800
Sq Ft
$680/Sq Ft
Est. Value
About This Home
This home is located at 20 Moore St, Natick, MA 01760 and is currently estimated at $1,223,443, approximately $679 per square foot. 20 Moore St is a home located in Middlesex County with nearby schools including Natick High School, Johnson Elementary School, and J F Kennedy Middle School.
Ownership History
Date
Name
Owned For
Owner Type
Purchase Details
Closed on
Jun 25, 2009
Sold by
Goff Robert L and Goff Judith Balo
Bought by
Garry Kyle P and Garry April L
Current Estimated Value
Home Financials for this Owner
Home Financials are based on the most recent Mortgage that was taken out on this home.
Original Mortgage
$381,600
Outstanding Balance
$244,073
Interest Rate
4.92%
Mortgage Type
Purchase Money Mortgage
Estimated Equity
$979,370
Create a Home Valuation Report for This Property
The Home Valuation Report is an in-depth analysis detailing your home's value as well as a comparison with similar homes in the area
Home Values in the Area
Average Home Value in this Area
Purchase History
| Date | Buyer | Sale Price | Title Company |
|---|---|---|---|
| Garry Kyle P | $424,000 | -- |
Source: Public Records
Mortgage History
| Date | Status | Borrower | Loan Amount |
|---|---|---|---|
| Open | Garry Kyle P | $381,600 |
Source: Public Records
Tax History Compared to Growth
Tax History
| Year | Tax Paid | Tax Assessment Tax Assessment Total Assessment is a certain percentage of the fair market value that is determined by local assessors to be the total taxable value of land and additions on the property. | Land | Improvement |
|---|---|---|---|---|
| 2025 | $14,153 | $1,183,400 | $425,800 | $757,600 |
| 2024 | $13,535 | $1,104,000 | $400,800 | $703,200 |
| 2023 | $13,172 | $1,042,100 | $385,700 | $656,400 |
| 2022 | $10,437 | $782,400 | $350,500 | $431,900 |
| 2021 | $9,965 | $732,200 | $330,500 | $401,700 |
| 2020 | $9,761 | $717,200 | $315,500 | $401,700 |
| 2019 | $9,116 | $717,200 | $315,500 | $401,700 |
| 2018 | $0 | $666,100 | $300,500 | $365,600 |
| 2017 | $8,868 | $657,400 | $255,600 | $401,800 |
| 2016 | $8,587 | $632,800 | $234,600 | $398,200 |
| 2015 | $8,275 | $598,800 | $234,600 | $364,200 |
Source: Public Records
Map
Nearby Homes
- 1 Fern St
- 28 Sylvester Rd
- 1 Proctor St
- 16 West St
- 5 Lanes End
- 7 Allison Way Unit 7
- 216-218 S Main St
- 25 Forest Ave
- 46 Silver Hill Ln Unit 1
- 40 Silver Hill Ln Unit 4
- 26 Walden Dr Unit 4
- 36 Silver Hill Ln Unit 21
- 3 Silver Hill Ln Unit 6
- 6 Floral Avenue Extension
- 16 Wayside Rd Unit 14
- 8 Floral Avenue Extension
- 58 W Central St
- 63 Pond St
- 8 Floral Ave Unit 8
- 1 Orchard View Cir Unit 1