Estimated Value: $833,000 - $1,082,000
3
Beds
4
Baths
3,177
Sq Ft
$304/Sq Ft
Est. Value
About This Home
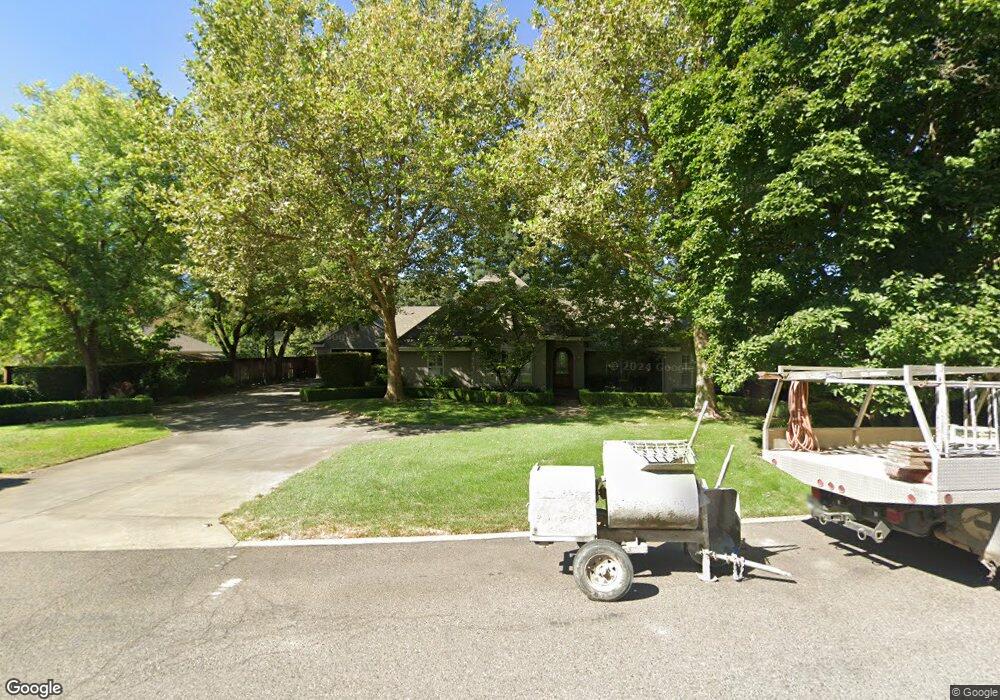
This home is located at 20 Oak Manor Ct, Chico, CA 95926 and is currently estimated at $965,123, approximately $303 per square foot. 20 Oak Manor Ct is a home located in Butte County with nearby schools including Sierra View Elementary School, Harry M. Marsh Junior High School, and Pleasant Valley High School.
Ownership History
Date
Name
Owned For
Owner Type
Purchase Details
Closed on
Sep 11, 2007
Sold by
Phillips Roger B and Phillips Lori M
Bought by
Phillips Roger B and Phillips Lori M
Current Estimated Value
Purchase Details
Closed on
Aug 19, 2004
Sold by
Womack Mark G and The Mark G Womack Trust
Bought by
Womack Mark G and Mark G Womack Trust
Purchase Details
Closed on
Nov 26, 1998
Sold by
Phillips Lori
Bought by
Phillips Roger B
Home Financials for this Owner
Home Financials are based on the most recent Mortgage that was taken out on this home.
Original Mortgage
$395,000
Outstanding Balance
$88,486
Interest Rate
6.62%
Estimated Equity
$876,637
Purchase Details
Closed on
Aug 18, 1997
Sold by
Savage Anthony H and Savage Jo Anne
Bought by
Phillips Roger B
Home Financials for this Owner
Home Financials are based on the most recent Mortgage that was taken out on this home.
Original Mortgage
$396,000
Interest Rate
7.43%
Create a Home Valuation Report for This Property
The Home Valuation Report is an in-depth analysis detailing your home's value as well as a comparison with similar homes in the area
Home Values in the Area
Average Home Value in this Area
Purchase History
| Date | Buyer | Sale Price | Title Company |
|---|---|---|---|
| Phillips Roger B | -- | None Available | |
| Phillips Roger B | -- | None Available | |
| Womack Mark G | -- | Mid Valley Title | |
| Phillips Roger B | -- | Fidelity National Title | |
| Phillips Roger B | $495,000 | Fidelity National Title Co |
Source: Public Records
Mortgage History
| Date | Status | Borrower | Loan Amount |
|---|---|---|---|
| Open | Phillips Roger B | $395,000 | |
| Closed | Phillips Roger B | $396,000 | |
| Closed | Phillips Roger B | $49,500 |
Source: Public Records
Tax History Compared to Growth
Tax History
| Year | Tax Paid | Tax Assessment Tax Assessment Total Assessment is a certain percentage of the fair market value that is determined by local assessors to be the total taxable value of land and additions on the property. | Land | Improvement |
|---|---|---|---|---|
| 2025 | $8,914 | $830,169 | $159,660 | $670,509 |
| 2024 | $8,914 | $813,892 | $156,530 | $657,362 |
| 2023 | $8,807 | $797,934 | $153,461 | $644,473 |
| 2022 | $8,666 | $782,289 | $150,452 | $631,837 |
| 2021 | $8,501 | $766,951 | $147,502 | $619,449 |
| 2020 | $8,477 | $759,088 | $145,990 | $613,098 |
| 2019 | $8,321 | $744,205 | $143,128 | $601,077 |
| 2018 | $8,167 | $729,614 | $140,322 | $589,292 |
| 2017 | $8,001 | $715,309 | $137,571 | $577,738 |
| 2016 | $7,299 | $701,284 | $134,874 | $566,410 |
| 2015 | $7,298 | $690,751 | $132,849 | $557,902 |
| 2014 | $7,121 | $677,221 | $130,247 | $546,974 |
Source: Public Records
Map
Nearby Homes
- 45 Covell Park Ave
- 1915 Manzanita Ave
- 102 Centennial Ave
- 23 Alameda Park Cir
- 2932 Pennyroyal Dr
- 23 Lower Lake Ct
- 1675 Manzanita Ave Unit 58
- 1675 Manzanita Ave Unit 82
- 1675 Manzanita Ave Unit 9
- 2910 Pennyroyal Dr
- 2875 Pennyroyal Dr Unit 46
- 2386 Farmington Ave
- 1702 Oak Vista Ave
- 853 Coit Tower Way
- 1595 Manzanita Ave Unit 3
- 8 Dana Point Rd
- 2740 Levi Ln
- 1659 Pendant Place
- 825 El Monte Ave
- 109 Sterling Oaks Dr
- 30 Oak Manor Ct
- 10 Oak Manor Ct
- 16 Salishan Ct
- 25 Oak Manor Ct
- 40 Oak Manor Ct
- 2060 Vallombrosa Ave
- 35 Oak Manor Ct
- 26 Salishan Ct
- 45 Oak Manor Ct
- 2000 Vallombrosa Ave
- 17 Salishan Ct
- 40 Allie Mae Ct
- 30 Covell Park Ave
- 2072 Vallombrosa Ave
- 27 Salishan Ct
- 50 Allie Mae Ct
- 30 Allie Mae Ct
- 2086 Vallombrosa Ave
- 1990 Vallombrosa Ave
- 1992 Vallombrosa Ave