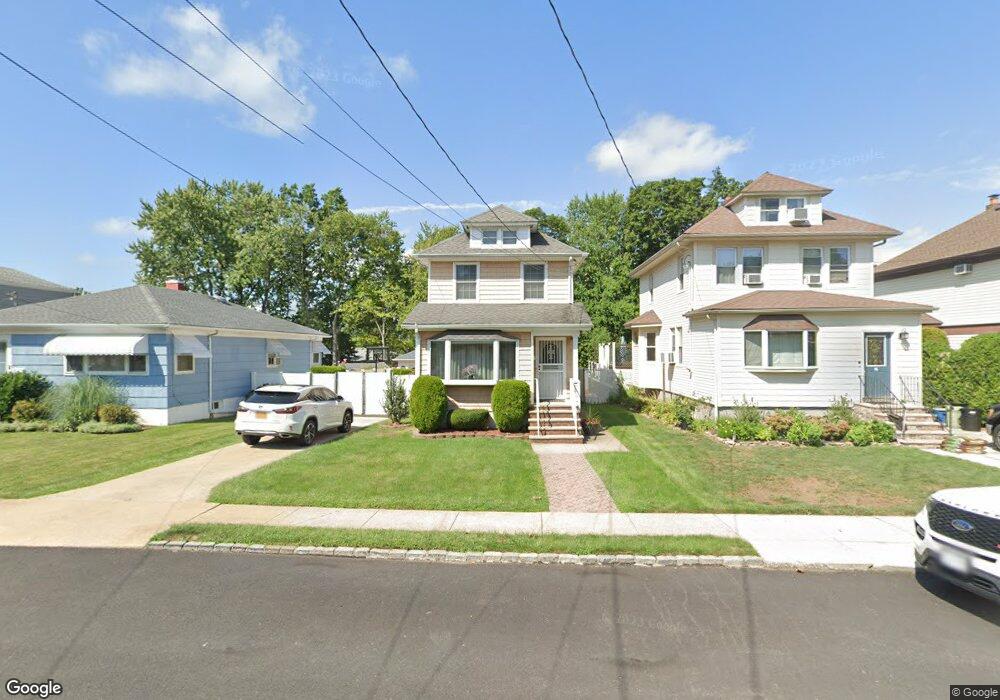
20 Oconnor Ave Staten Island, NY 10314
Westerleigh NeighborhoodEstimated Value: $736,000 - $774,000
Studio
4
Baths
1,408
Sq Ft
$534/Sq Ft
Est. Value
About This Home
This home is located at 20 Oconnor Ave, Staten Island, NY 10314 and is currently estimated at $751,352, approximately $533 per square foot. 20 Oconnor Ave is a home located in Richmond County with nearby schools including P.S. 30 Westerleigh, I.S. 51 Edwin Markham, and Port Richmond High School.
Ownership History
Date
Name
Owned For
Owner Type
Purchase Details
Closed on
May 10, 2013
Sold by
Shevack Gregory and Burrows Tricia M
Bought by
Shevack Gregory and Shevack Tricia M
Current Estimated Value
Purchase Details
Closed on
Jun 18, 2008
Sold by
Dangelo Joseph M and Dangelo Janine
Bought by
Buck Joshua Wayne and Buck Christina Nicole
Home Financials for this Owner
Home Financials are based on the most recent Mortgage that was taken out on this home.
Original Mortgage
$409,718
Outstanding Balance
$263,183
Interest Rate
6.07%
Mortgage Type
VA
Estimated Equity
$488,169
Purchase Details
Closed on
Aug 25, 2006
Sold by
Ahlborn Steven and Ahlborn Nancy
Bought by
Shevack Gregory and Burrows Tricia M
Home Financials for this Owner
Home Financials are based on the most recent Mortgage that was taken out on this home.
Original Mortgage
$352,500
Interest Rate
6.79%
Mortgage Type
Purchase Money Mortgage
Purchase Details
Closed on
Jan 10, 2002
Sold by
Crisham Margaret T
Bought by
Ahlborn Steven and Ahlborn Nancy
Home Financials for this Owner
Home Financials are based on the most recent Mortgage that was taken out on this home.
Original Mortgage
$236,000
Interest Rate
7.04%
Create a Home Valuation Report for This Property
The Home Valuation Report is an in-depth analysis detailing your home's value as well as a comparison with similar homes in the area
Home Values in the Area
Average Home Value in this Area
Purchase History
| Date | Buyer | Sale Price | Title Company |
|---|---|---|---|
| Shevack Gregory | -- | Chicago Title Insurance Co | |
| Buck Joshua Wayne | $413,500 | None Available | |
| Shevack Gregory | $470,000 | First Amer Title Ins Co Ny | |
| Ahlborn Steven | $295,000 | Stewart Title |
Source: Public Records
Mortgage History
| Date | Status | Borrower | Loan Amount |
|---|---|---|---|
| Open | Buck Joshua Wayne | $409,718 | |
| Previous Owner | Shevack Gregory | $352,500 | |
| Previous Owner | Ahlborn Steven | $236,000 |
Source: Public Records
Tax History
| Year | Tax Paid | Tax Assessment Tax Assessment Total Assessment is a certain percentage of the fair market value that is determined by local assessors to be the total taxable value of land and additions on the property. | Land | Improvement |
|---|---|---|---|---|
| 2025 | $6,597 | $42,480 | $11,015 | $31,465 |
| 2024 | $6,597 | $38,400 | $11,495 | $26,905 |
| 2023 | $6,223 | $30,985 | $9,205 | $21,780 |
| 2022 | $5,836 | $40,560 | $13,440 | $27,120 |
| 2021 | $5,849 | $38,820 | $13,440 | $25,380 |
| 2020 | $5,845 | $34,500 | $13,440 | $21,060 |
| 2019 | $5,433 | $35,400 | $13,440 | $21,960 |
| 2018 | $4,966 | $25,821 | $11,253 | $14,568 |
| 2017 | $4,666 | $24,360 | $13,440 | $10,920 |
| 2016 | $4,836 | $25,740 | $13,440 | $12,300 |
| 2015 | $4,475 | $25,020 | $14,100 | $10,920 |
| 2014 | $4,475 | $24,909 | $14,037 | $10,872 |
Source: Public Records
Map
Nearby Homes
- 74 Caswell Ave
- 26 Iowa Place
- 25 Ardmore Ave
- 202 Watchogue Rd
- 295 Watchogue Rd
- 63 Avon Ln
- 24 Frederick St
- 41 Martin Ave
- 91 Wade St
- 68 Carmel Ave
- 299 Saint John Ave
- 279 Dickie Ave
- 119 Watchogue Rd
- 3 Mann Ave
- 268 Neal Dow Ave
- 259 Dickie Ave
- 88 Ardmore Ave
- 260 Saint John Ave
- 246 Neal Dow Ave
- 74 Vogel Loop
Your Personal Tour Guide
Ask me questions while you tour the home.