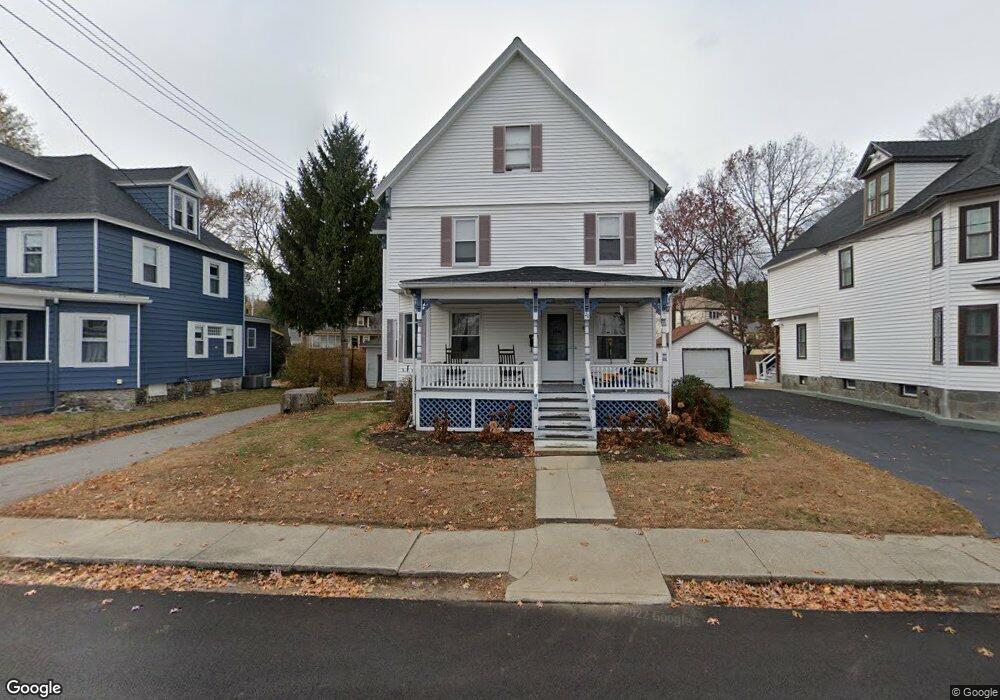
20 Oneil St Hudson, MA 01749
Estimated Value: $536,408 - $624,000
4
Beds
2
Baths
1,724
Sq Ft
$340/Sq Ft
Est. Value
About This Home
This home is located at 20 Oneil St, Hudson, MA 01749 and is currently estimated at $586,602, approximately $340 per square foot. 20 Oneil St is a home located in Middlesex County with nearby schools including David J. Quinn Middle School, Hudson High School, and First Steps Children's Center.
Ownership History
Date
Name
Owned For
Owner Type
Purchase Details
Closed on
Jul 27, 2001
Sold by
Martin David K and Loughlin Bonnie-Ellen
Bought by
Harmon Paul V and Harmon Deborah E
Current Estimated Value
Home Financials for this Owner
Home Financials are based on the most recent Mortgage that was taken out on this home.
Original Mortgage
$206,500
Outstanding Balance
$80,727
Interest Rate
7.18%
Mortgage Type
Purchase Money Mortgage
Estimated Equity
$505,875
Purchase Details
Closed on
Mar 13, 1998
Sold by
Tortolani Michelle F
Bought by
Harmon Paul V and Harmon Deborah E
Purchase Details
Closed on
Dec 16, 1988
Sold by
Fox Lowell R
Bought by
Martin David K
Create a Home Valuation Report for This Property
The Home Valuation Report is an in-depth analysis detailing your home's value as well as a comparison with similar homes in the area
Home Values in the Area
Average Home Value in this Area
Purchase History
| Date | Buyer | Sale Price | Title Company |
|---|---|---|---|
| Harmon Paul V | $259,000 | -- | |
| Harmon Paul V | $139,000 | -- | |
| Martin David K | $140,000 | -- |
Source: Public Records
Mortgage History
| Date | Status | Borrower | Loan Amount |
|---|---|---|---|
| Open | Martin David K | $40,000 | |
| Open | Martin David K | $206,500 |
Source: Public Records
Tax History
| Year | Tax Paid | Tax Assessment Tax Assessment Total Assessment is a certain percentage of the fair market value that is determined by local assessors to be the total taxable value of land and additions on the property. | Land | Improvement |
|---|---|---|---|---|
| 2025 | $6,286 | $452,900 | $162,600 | $290,300 |
| 2024 | $5,943 | $424,500 | $147,800 | $276,700 |
| 2023 | $5,785 | $396,200 | $142,100 | $254,100 |
| 2022 | $5,370 | $338,600 | $129,200 | $209,400 |
| 2021 | $5,236 | $315,600 | $123,000 | $192,600 |
| 2020 | $4,880 | $293,800 | $120,600 | $173,200 |
| 2019 | $6,450 | $292,500 | $120,600 | $171,900 |
| 2018 | $8,798 | $266,100 | $114,900 | $151,200 |
| 2017 | $4,312 | $246,400 | $109,400 | $137,000 |
| 2016 | $4,170 | $241,200 | $109,400 | $131,800 |
| 2015 | $4,295 | $248,700 | $109,400 | $139,300 |
| 2014 | $4,106 | $235,700 | $95,900 | $139,800 |
Source: Public Records
Map
Nearby Homes
- 2 Barracks Rd Unit 2
- 133 Lincoln St
- 18-24 River St Unit 12
- 21 Felton St
- 46 Church St Unit 2
- 4 Linden St
- 128 Manning St
- 25 Richard Rd
- 136 Central St Unit C6
- 17 School St Unit C
- 17 School St Unit A
- 110 River St
- 16 Barnes Blvd Unit 16
- 200 Manning St Unit 20A
- 200 Manning St Unit 6B
- 16 Houghton St
- 3 Gerry Dr Unit 15
- 56 Park St
- 3 Highland Park Ave
- 37 Tower St
Your Personal Tour Guide
Ask me questions while you tour the home.