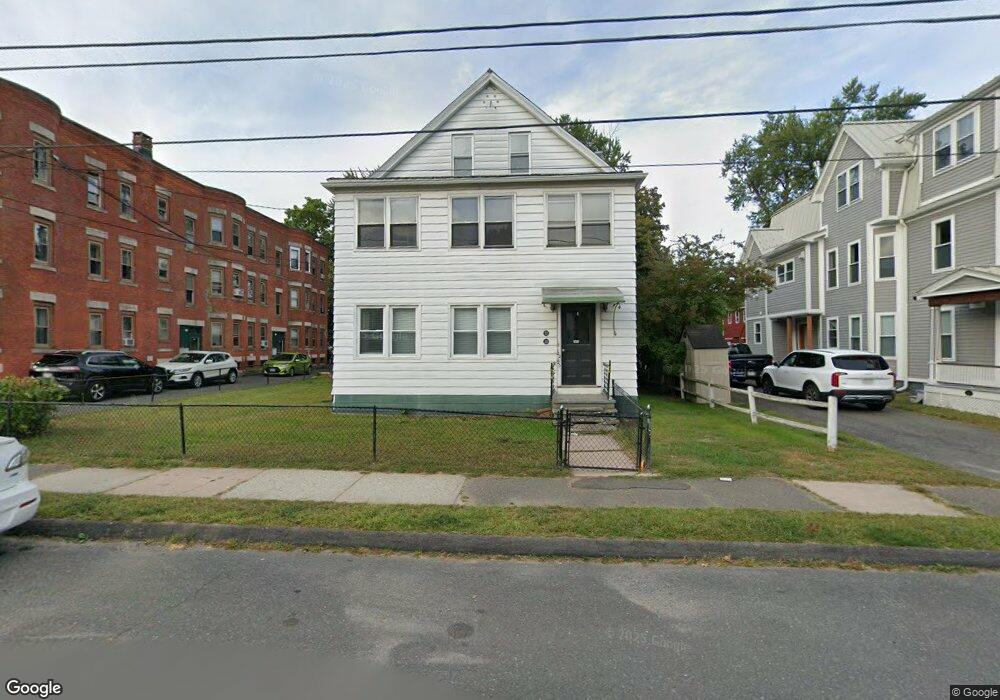
20 Orchard St Northampton, MA 01060
Estimated Value: $707,000 - $964,000
5
Beds
3
Baths
2,911
Sq Ft
$278/Sq Ft
Est. Value
About This Home
This home is located at 20 Orchard St, Northampton, MA 01060 and is currently estimated at $807,939, approximately $277 per square foot. 20 Orchard St is a home located in Hampshire County with nearby schools including Northampton High School, The Montessori School of Northampton, and Campus School of Smith College.
Ownership History
Date
Name
Owned For
Owner Type
Purchase Details
Closed on
Dec 19, 2024
Sold by
Bittel Luke
Bought by
Northampton Rentals Llc
Current Estimated Value
Home Financials for this Owner
Home Financials are based on the most recent Mortgage that was taken out on this home.
Original Mortgage
$616,000
Outstanding Balance
$608,922
Interest Rate
6.79%
Mortgage Type
Commercial
Estimated Equity
$199,017
Purchase Details
Closed on
Feb 21, 2020
Sold by
Peter J Bittel T
Bought by
Bittel Luke
Purchase Details
Closed on
Dec 1, 1998
Sold by
Ayers Lea R and Cowdrey Mark L
Bought by
Bitel Peter J
Home Financials for this Owner
Home Financials are based on the most recent Mortgage that was taken out on this home.
Original Mortgage
$138,250
Interest Rate
6.83%
Mortgage Type
Purchase Money Mortgage
Purchase Details
Closed on
Jul 30, 1993
Sold by
Allen Edward A
Bought by
Cowdrey Mark L
Create a Home Valuation Report for This Property
The Home Valuation Report is an in-depth analysis detailing your home's value as well as a comparison with similar homes in the area
Home Values in the Area
Average Home Value in this Area
Purchase History
| Date | Buyer | Sale Price | Title Company |
|---|---|---|---|
| Northampton Rentals Llc | $760,000 | None Available | |
| Bittel Luke | -- | None Available | |
| Peter J Bittel T | -- | None Available | |
| Bitel Peter J | $197,900 | -- | |
| Bitel Peter J | $197,900 | -- | |
| Cowdrey Mark L | $160,000 | -- |
Source: Public Records
Mortgage History
| Date | Status | Borrower | Loan Amount |
|---|---|---|---|
| Open | Northampton Rentals Llc | $616,000 | |
| Previous Owner | Cowdrey Mark L | $240,000 | |
| Previous Owner | Cowdrey Mark L | $138,250 |
Source: Public Records
Tax History
| Year | Tax Paid | Tax Assessment Tax Assessment Total Assessment is a certain percentage of the fair market value that is determined by local assessors to be the total taxable value of land and additions on the property. | Land | Improvement |
|---|---|---|---|---|
| 2025 | $7,174 | $515,000 | $142,400 | $372,600 |
| 2024 | $7,522 | $495,200 | $163,300 | $331,900 |
| 2023 | $6,987 | $441,100 | $148,400 | $292,700 |
| 2022 | $6,566 | $367,000 | $138,700 | $228,300 |
| 2021 | $6,238 | $359,100 | $132,100 | $227,000 |
| 2020 | $6,033 | $359,100 | $132,100 | $227,000 |
| 2019 | $5,979 | $344,200 | $132,100 | $212,100 |
| 2018 | $6,244 | $363,300 | $132,100 | $231,200 |
| 2017 | $6,063 | $363,300 | $132,100 | $231,200 |
| 2016 | $5,871 | $363,300 | $132,100 | $231,200 |
| 2015 | $5,528 | $349,900 | $124,600 | $225,300 |
| 2014 | $5,385 | $349,900 | $124,600 | $225,300 |
Source: Public Records
Map
Nearby Homes
- 30 View Ave
- 22 Woodbine Ave
- 35 Day Ave
- 5 Pomeroy Terrace Unit 2
- 25 Union St
- 25 Union St Unit 2
- 30B Graves Ave Unit B
- 13 Finn St
- 10 Hawley St Unit 4C
- 10 Hawley St Unit 4D
- 10 Hawley St Unit 4B
- 10 Hawley St Unit 4A
- 51 Phillips Place Unit 1
- 37 Finn St
- 19 Trumbull Rd
- 61 Crescent St Unit 7
- 29 Pleasant St Unit 1
- 43 Center St Unit K
- 23 Eastern Ave
- 26 Crescent St Unit G2
- 18 Orchard St
- 30 Orchard St
- 14 Orchard St
- 23 Orchard St
- 23 Orchard St Unit 23
- 21 Orchard St
- 21 Orchard St Unit 21
- 17 Orchard St
- 25 Orchard St
- 27 Orchard St
- 15 Orchard St
- 36 Orchard St
- 29 Orchard St
- 24 Elizabeth St
- 22 Elizabeth St
- 33 Orchard St
- 28 Elizabeth St
- 20 Elizabeth St
- 9 Orchard St
- 7 Orchard St
Your Personal Tour Guide
Ask me questions while you tour the home.