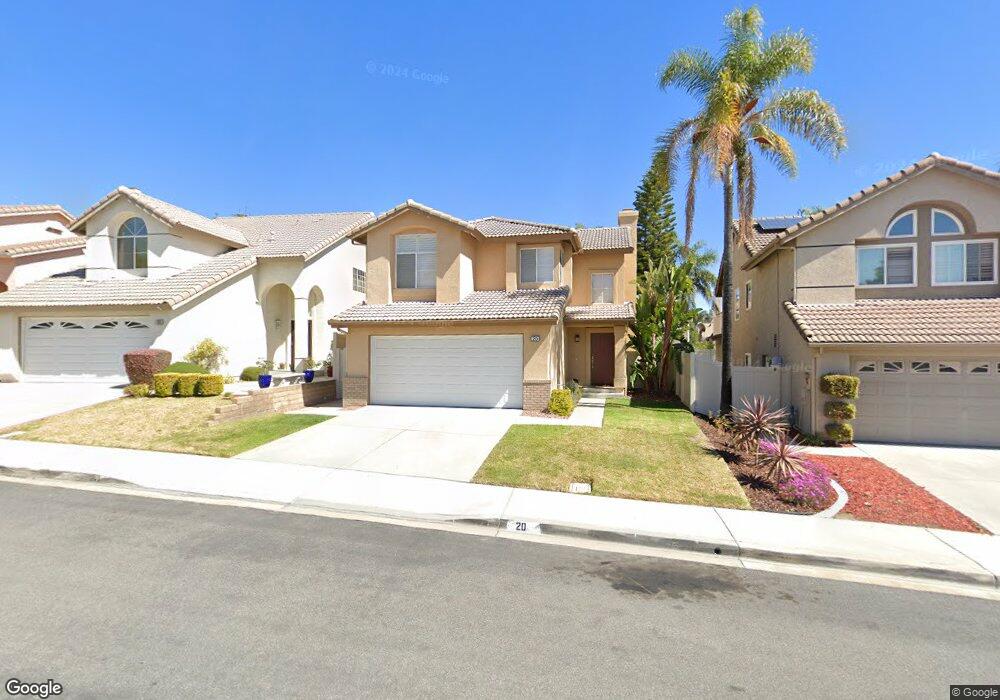
20 Parrell Ave Foothill Ranch, CA 92610
Estimated Value: $1,078,421 - $1,167,000
4
Beds
3
Baths
1,471
Sq Ft
$761/Sq Ft
Est. Value
About This Home
This home is located at 20 Parrell Ave, Foothill Ranch, CA 92610 and is currently estimated at $1,120,105, approximately $761 per square foot. 20 Parrell Ave is a home located in Orange County with nearby schools including Foothill Ranch Elementary School, Rancho Santa Margarita Intermediate School, and Trabuco Hills High School.
Ownership History
Date
Name
Owned For
Owner Type
Purchase Details
Closed on
Dec 7, 2009
Sold by
Santillan Annette
Bought by
Santillan Felipe
Current Estimated Value
Home Financials for this Owner
Home Financials are based on the most recent Mortgage that was taken out on this home.
Original Mortgage
$441,849
Outstanding Balance
$293,332
Interest Rate
5.25%
Mortgage Type
FHA
Estimated Equity
$826,773
Purchase Details
Closed on
Dec 2, 2009
Sold by
Santillan Felipe
Bought by
Pettersen Christopher and Pettersen Luz R
Home Financials for this Owner
Home Financials are based on the most recent Mortgage that was taken out on this home.
Original Mortgage
$441,849
Outstanding Balance
$293,332
Interest Rate
5.25%
Mortgage Type
FHA
Estimated Equity
$826,773
Create a Home Valuation Report for This Property
The Home Valuation Report is an in-depth analysis detailing your home's value as well as a comparison with similar homes in the area
Home Values in the Area
Average Home Value in this Area
Purchase History
| Date | Buyer | Sale Price | Title Company |
|---|---|---|---|
| Santillan Felipe | -- | Chicago Title Company | |
| Pettersen Christopher | $450,000 | Chicago Title Company |
Source: Public Records
Mortgage History
| Date | Status | Borrower | Loan Amount |
|---|---|---|---|
| Open | Pettersen Christopher | $441,849 |
Source: Public Records
Tax History
| Year | Tax Paid | Tax Assessment Tax Assessment Total Assessment is a certain percentage of the fair market value that is determined by local assessors to be the total taxable value of land and additions on the property. | Land | Improvement |
|---|---|---|---|---|
| 2025 | $5,909 | $580,864 | $384,520 | $196,344 |
| 2024 | $5,909 | $569,475 | $376,980 | $192,495 |
| 2023 | $5,769 | $558,309 | $369,588 | $188,721 |
| 2022 | $5,665 | $547,362 | $362,341 | $185,021 |
| 2021 | $5,053 | $536,630 | $355,236 | $181,394 |
| 2020 | $5,500 | $531,128 | $351,593 | $179,535 |
| 2019 | $5,389 | $520,714 | $344,699 | $176,015 |
| 2018 | $5,287 | $510,504 | $337,940 | $172,564 |
| 2017 | $5,180 | $500,495 | $331,314 | $169,181 |
| 2016 | $5,662 | $490,682 | $324,818 | $165,864 |
| 2015 | $5,633 | $483,312 | $319,939 | $163,373 |
| 2014 | $6,041 | $473,845 | $313,672 | $160,173 |
Source: Public Records
Map
Nearby Homes
- 39 Touraine Place
- 19431 14H Rue de Valore
- 19431 57D Rue de Valore
- 38 Tessera Ave
- 208 Chaumont Cir Unit 113
- 277 Chaumont Cir
- 19431 Rue de Valore Unit 19B
- 19431 Rue de Valore Unit 14A
- 16 Balustrade Place
- 20 Flores
- 5 Encinal
- 2 Alamitos
- 32 Salinas
- 64 Calle Cabrillo
- 406 El Paseo
- 1161 Summit Oak Dr
- 28312 Pueblo Dr
- 115 Primrose Dr
- 18 Alonda
- 28372 Boulder Dr
- 18 Parrell Ave
- 22 Parrell Ave
- 16 Parrell Ave
- 24 Parrell Ave
- 21 Touraine Place
- 23 Touraine Place
- 19 Touraine Place
- 27 Touraine Place
- 17 Touraine Place
- 12 Parrell Ave
- 26 Parrell Ave
- 29 Touraine Place
- 15 Touraine Place
- 21 Parrell Ave
- 17 Parrell Ave
- 10 Parrell Ave
- 31 Touraine Place
- 23 Parrell Ave
- 28 Parrell Ave
- 11 Touraine Place
Your Personal Tour Guide
Ask me questions while you tour the home.