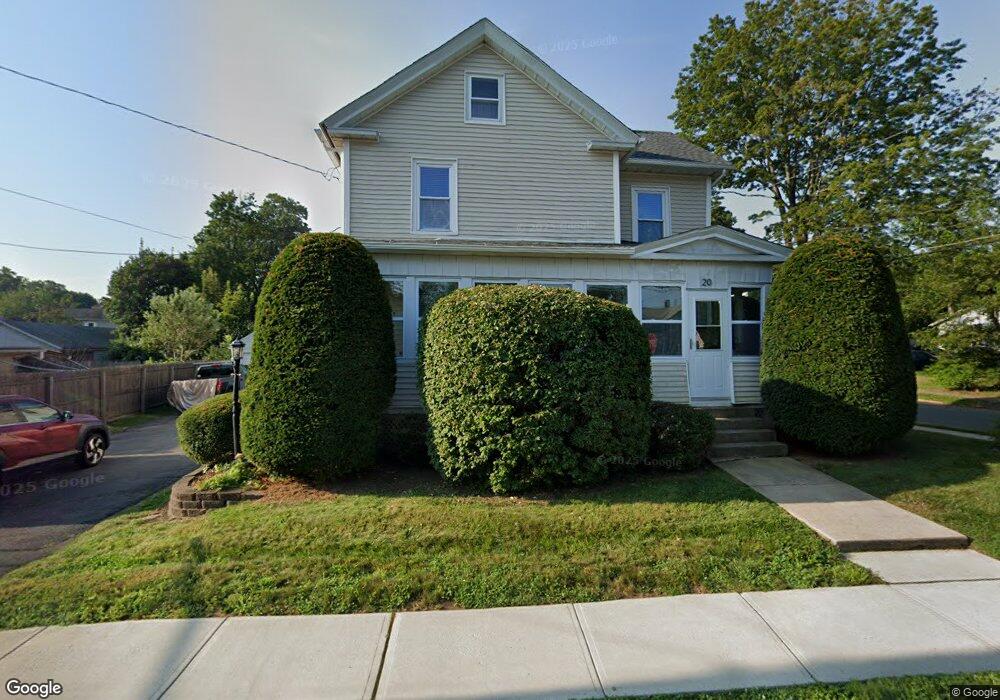
20 Pease St Enfield, CT 06082
Estimated Value: $286,000 - $320,000
3
Beds
2
Baths
1,945
Sq Ft
$156/Sq Ft
Est. Value
About This Home
This home is located at 20 Pease St, Enfield, CT 06082 and is currently estimated at $303,478, approximately $156 per square foot. 20 Pease St is a home located in Hartford County with nearby schools including Enfield Street Elementary School, Edgar H. Parkman School, and John F. Kennedy Middle School.
Ownership History
Date
Name
Owned For
Owner Type
Purchase Details
Closed on
Oct 18, 2016
Sold by
Ciszek Brent A and Testori Peter A
Bought by
Testori Peter A
Current Estimated Value
Purchase Details
Closed on
May 1, 2007
Sold by
Krogman Scott and Krogman Jennifer
Bought by
Ciszek Brent and Testori Peter
Home Financials for this Owner
Home Financials are based on the most recent Mortgage that was taken out on this home.
Original Mortgage
$100,000
Interest Rate
6.23%
Purchase Details
Closed on
Dec 31, 1998
Sold by
Johnston Anita
Bought by
Krogman Scott and Krogman Jennifer
Create a Home Valuation Report for This Property
The Home Valuation Report is an in-depth analysis detailing your home's value as well as a comparison with similar homes in the area
Home Values in the Area
Average Home Value in this Area
Purchase History
| Date | Buyer | Sale Price | Title Company |
|---|---|---|---|
| Testori Peter A | -- | -- | |
| Ciszek Brent | $188,000 | -- | |
| Krogman Scott | $91,000 | -- |
Source: Public Records
Mortgage History
| Date | Status | Borrower | Loan Amount |
|---|---|---|---|
| Previous Owner | Krogman Scott | $175,500 | |
| Previous Owner | Krogman Scott | $100,000 | |
| Previous Owner | Krogman Scott | $188,000 | |
| Previous Owner | Krogman Scott | $91,841 |
Source: Public Records
Tax History Compared to Growth
Tax History
| Year | Tax Paid | Tax Assessment Tax Assessment Total Assessment is a certain percentage of the fair market value that is determined by local assessors to be the total taxable value of land and additions on the property. | Land | Improvement |
|---|---|---|---|---|
| 2025 | $5,181 | $138,900 | $35,100 | $103,800 |
| 2024 | $5,042 | $138,900 | $35,100 | $103,800 |
| 2023 | $5,042 | $138,900 | $35,100 | $103,800 |
| 2022 | $4,671 | $138,900 | $35,100 | $103,800 |
| 2021 | $4,357 | $106,040 | $29,040 | $77,000 |
| 2020 | $4,315 | $106,040 | $29,040 | $77,000 |
| 2019 | $4,350 | $106,040 | $29,040 | $77,000 |
| 2018 | $4,255 | $106,040 | $29,040 | $77,000 |
| 2017 | $4,217 | $106,040 | $29,040 | $77,000 |
| 2016 | $4,083 | $104,160 | $29,040 | $75,120 |
| 2015 | $3,982 | $104,160 | $29,040 | $75,120 |
| 2014 | $3,789 | $104,160 | $29,040 | $75,120 |
Source: Public Records
Map
Nearby Homes